
When you buy shares in a company, it's worth keeping in mind the possibility that it could fail, and you could lose your money. But on the bright side, if you buy shares in a high quality company at the right price, you can gain well over 100%. For instance, the price of CNOOC Limited (HKG:883) stock is up an impressive 159% over the last five years. Meanwhile the share price is 1.7% higher than it was a week ago.
So let's investigate and see if the longer term performance of the company has been in line with the underlying business' progress.
View our latest analysis for CNOOC
There is no denying that markets are sometimes efficient, but prices do not always reflect underlying business performance. One imperfect but simple way to consider how the market perception of a company has shifted is to compare the change in the earnings per share (EPS) with the share price movement.
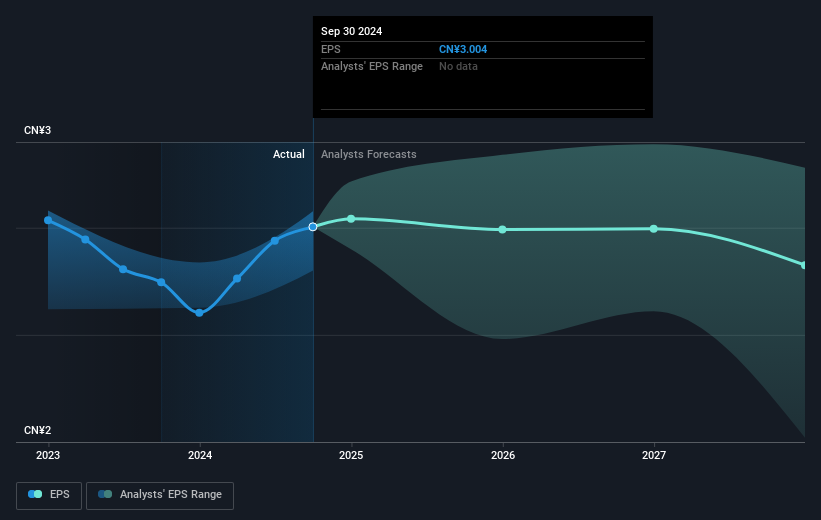
Over half a decade, CNOOC managed to grow its earnings per share at 18% a year. This EPS growth is reasonably close to the 21% average annual increase in the share price. This indicates that investor sentiment towards the company has not changed a great deal. In fact, the share price seems to largely reflect the EPS growth.
The company's earnings per share (over time) is depicted in the image below (click to see the exact numbers).
We're pleased to report that the CEO is remunerated more modestly than most CEOs at similarly capitalized companies. But while CEO remuneration is always worth checking, the really important question is whether the company can grow earnings going forward. It might be well worthwhile taking a look at our free report on CNOOC's earnings, revenue and cash flow.
What About Dividends?
As well as measuring the share price return, investors should also consider the total shareholder return (TSR). Whereas the share price return only reflects the change in the share price, the TSR includes the value of dividends (assuming they were reinvested) and the benefit of any discounted capital raising or spin-off. It's fair to say that the TSR gives a more complete picture for stocks that pay a dividend. We note that for CNOOC the TSR over the last 5 years was 320%, which is better than the share price return mentioned above. And there's no prize for guessing that the dividend payments largely explain the divergence!
A Different Perspective
CNOOC shareholders gained a total return of 8.5% during the year. Unfortunately this falls short of the market return. If we look back over five years, the returns are even better, coming in at 33% per year for five years. It's quite possible the business continues to execute with prowess, even as the share price gains are slowing. It's always interesting to track share price performance over the longer term. But to understand CNOOC better, we need to consider many other factors. Case in point: We've spotted 2 warning signs for CNOOC you should be aware of, and 1 of them is potentially serious.
We will like CNOOC better if we see some big insider buys. While we wait, check out this free list of undervalued stocks (mostly small caps) with considerable, recent, insider buying.
Please note, the market returns quoted in this article reflect the market weighted average returns of stocks that currently trade on Hong Kong exchanges.
Have feedback on this article? Concerned about the content? Get in touch with us directly. Alternatively, email editorial-team (at) simplywallst.com.
This article by Simply Wall St is general in nature. We provide commentary based on historical data and analyst forecasts only using an unbiased methodology and our articles are not intended to be financial advice. It does not constitute a recommendation to buy or sell any stock, and does not take account of your objectives, or your financial situation. We aim to bring you long-term focused analysis driven by fundamental data. Note that our analysis may not factor in the latest price-sensitive company announcements or qualitative material. Simply Wall St has no position in any stocks mentioned.