
Xinyi Energy Holdings Limited (HKG:3868) shareholders would be excited to see that the share price has had a great month, posting a 26% gain and recovering from prior weakness. Unfortunately, the gains of the last month did little to right the losses of the last year with the stock still down 18% over that time.
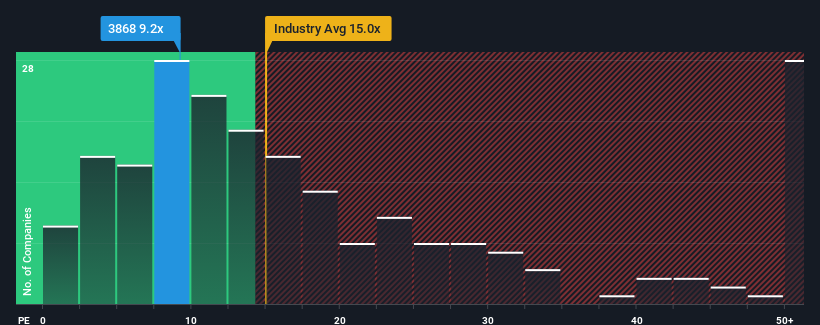
Although its price has surged higher, there still wouldn't be many who think Xinyi Energy Holdings' price-to-earnings (or "P/E") ratio of 9.2x is worth a mention when the median P/E in Hong Kong is similar at about 10x. However, investors might be overlooking a clear opportunity or potential setback if there is no rational basis for the P/E.
Xinyi Energy Holdings could be doing better as its earnings have been going backwards lately while most other companies have been seeing positive earnings growth. One possibility is that the P/E is moderate because investors think this poor earnings performance will turn around. You'd really hope so, otherwise you're paying a relatively elevated price for a company with this sort of growth profile.
See our latest analysis for Xinyi Energy Holdings
Is There Some Growth For Xinyi Energy Holdings?
There's an inherent assumption that a company should be matching the market for P/E ratios like Xinyi Energy Holdings' to be considered reasonable.
Taking a look back first, the company's earnings per share growth last year wasn't something to get excited about as it posted a disappointing decline of 16%. As a result, earnings from three years ago have also fallen 33% overall. So unfortunately, we have to acknowledge that the company has not done a great job of growing earnings over that time.
Looking ahead now, EPS is anticipated to climb by 11% per year during the coming three years according to the nine analysts following the company. Meanwhile, the rest of the market is forecast to expand by 12% per annum, which is not materially different.
In light of this, it's understandable that Xinyi Energy Holdings' P/E sits in line with the majority of other companies. Apparently shareholders are comfortable to simply hold on while the company is keeping a low profile.
What We Can Learn From Xinyi Energy Holdings' P/E?
Xinyi Energy Holdings appears to be back in favour with a solid price jump getting its P/E back in line with most other companies. It's argued the price-to-earnings ratio is an inferior measure of value within certain industries, but it can be a powerful business sentiment indicator.
As we suspected, our examination of Xinyi Energy Holdings' analyst forecasts revealed that its market-matching earnings outlook is contributing to its current P/E. Right now shareholders are comfortable with the P/E as they are quite confident future earnings won't throw up any surprises. It's hard to see the share price moving strongly in either direction in the near future under these circumstances.
Having said that, be aware Xinyi Energy Holdings is showing 2 warning signs in our investment analysis, and 1 of those can't be ignored.
If these risks are making you reconsider your opinion on Xinyi Energy Holdings, explore our interactive list of high quality stocks to get an idea of what else is out there.
Have feedback on this article? Concerned about the content? Get in touch with us directly. Alternatively, email editorial-team (at) simplywallst.com.
This article by Simply Wall St is general in nature. We provide commentary based on historical data and analyst forecasts only using an unbiased methodology and our articles are not intended to be financial advice. It does not constitute a recommendation to buy or sell any stock, and does not take account of your objectives, or your financial situation. We aim to bring you long-term focused analysis driven by fundamental data. Note that our analysis may not factor in the latest price-sensitive company announcements or qualitative material. Simply Wall St has no position in any stocks mentioned.