
As global markets navigate a landscape of policy risks and economic uncertainties, many investors are turning their attention to opportunities in Asia. Penny stocks, though an older term, continue to represent a segment of the market where smaller or emerging companies can offer significant potential for growth at lower price points. By focusing on those with robust financials and solid fundamentals, investors can uncover hidden gems that stand out for their financial strength and promise as long-term investments.
Top 10 Penny Stocks In Asia
| Name | Share Price | Market Cap | Financial Health Rating |
| Bosideng International Holdings (SEHK:3998) | HK$3.72 | HK$42.71B | ★★★★★★ |
| Yangzijiang Shipbuilding (Holdings) (SGX:BS6) | SGD2.34 | SGD9.24B | ★★★★★☆ |
| T.A.C. Consumer (SET:TACC) | THB4.20 | THB2.52B | ★★★★★★ |
| Activation Group Holdings (SEHK:9919) | HK$0.87 | HK$647.93M | ★★★★★★ |
| China Sunsine Chemical Holdings (SGX:QES) | SGD0.475 | SGD452.86M | ★★★★★★ |
| Xiamen Hexing Packaging Printing (SZSE:002228) | CN¥3.05 | CN¥3.53B | ★★★★★★ |
| Lever Style (SEHK:1346) | HK$1.26 | HK$799.83M | ★★★★★★ |
| Newborn Town (SEHK:9911) | HK$4.73 | HK$6.67B | ★★★★★★ |
| Beng Kuang Marine (SGX:BEZ) | SGD0.205 | SGD40.84M | ★★★★★★ |
| China Lilang (SEHK:1234) | HK$4.00 | HK$4.79B | ★★★★★☆ |
Click here to see the full list of 1,171 stocks from our Asian Penny Stocks screener.
Here's a peek at a few of the choices from the screener.
NZME (NZSE:NZM)
Simply Wall St Financial Health Rating: ★★★★☆☆
Overview: NZME Limited, along with its subsidiaries, operates in the integrated media and entertainment sector in New Zealand with a market cap of NZ$216.08 million.
Operations: NZME's revenue is primarily derived from its Publishing segment at NZ$200.32 million, followed by Audio at NZ$116.28 million and Oneroof contributing NZ$27.16 million.
Market Cap: NZ$216.08M
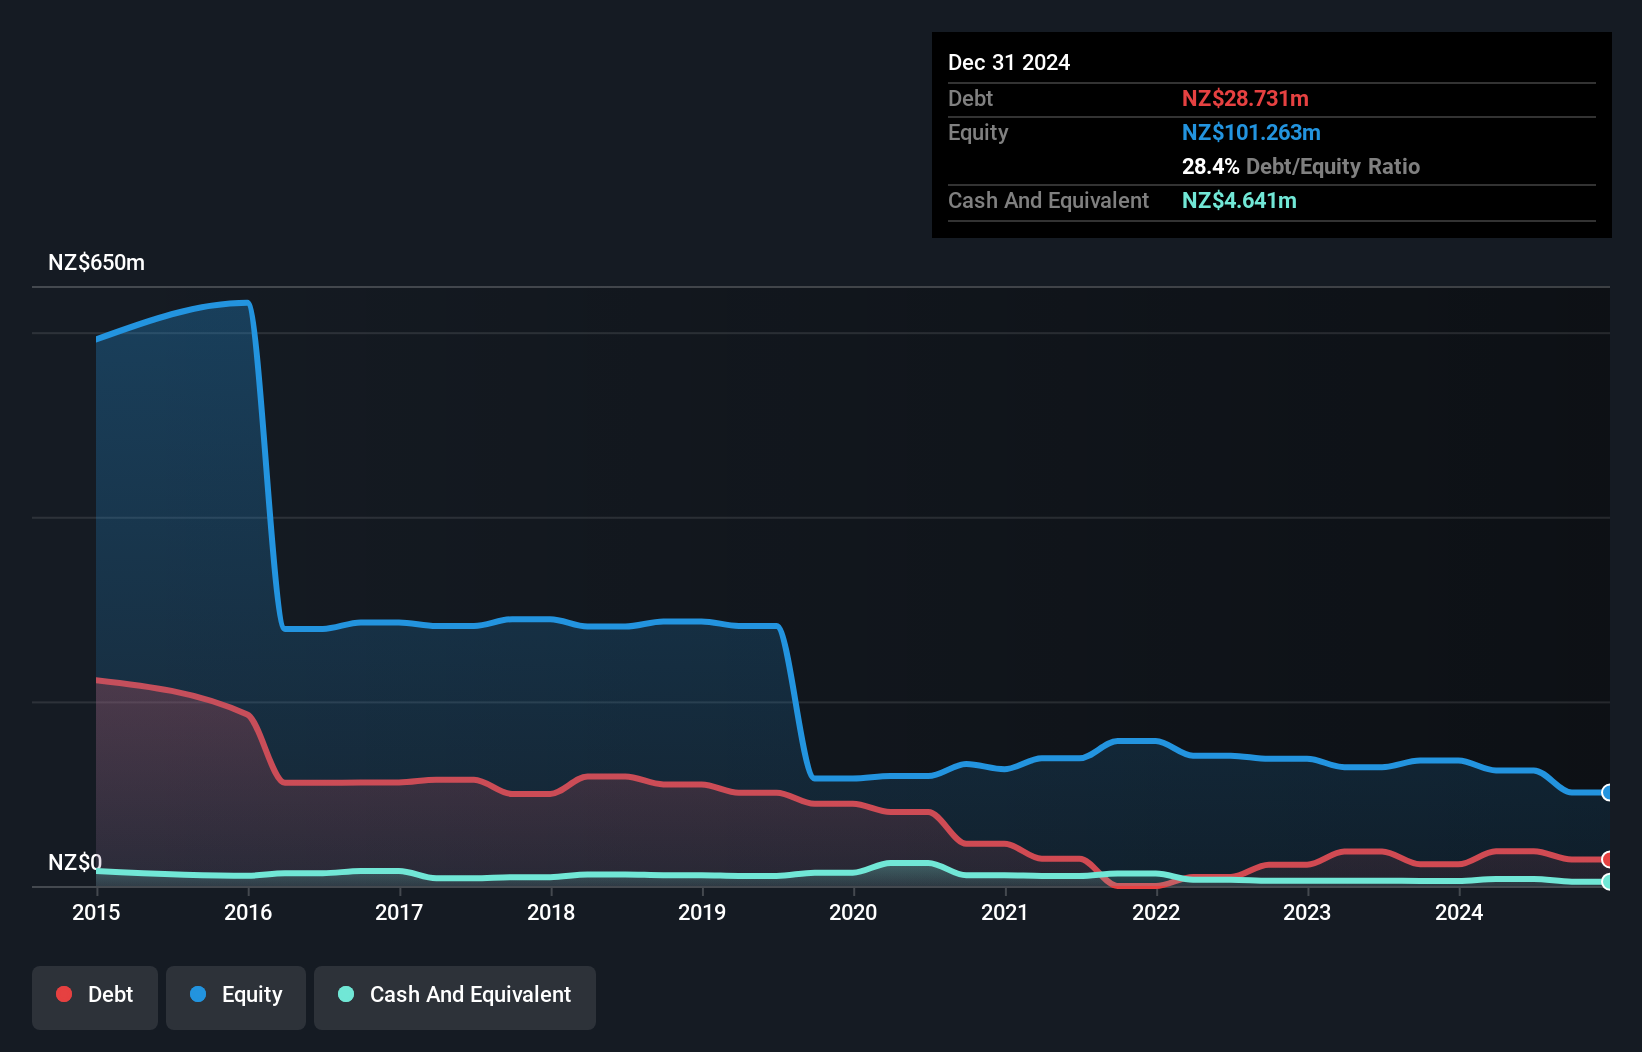
NZME Limited, operating within the integrated media and entertainment sector in New Zealand, reported a net loss of NZ$16.04 million for 2024 despite revenue reaching NZ$350.63 million. The company has managed to reduce its losses over the past five years by a significant rate annually and maintains a satisfactory net debt to equity ratio of 23.8%. While unprofitable, NZME has a sufficient cash runway exceeding three years with stable free cash flow. The proposed dividend of 6 cents per share may not be well-covered by earnings, highlighting potential risks for investors seeking income stability from this penny stock investment.
- Unlock comprehensive insights into our analysis of NZME stock in this financial health report.
- Gain insights into NZME's future direction by reviewing our growth report.
NagaCorp (SEHK:3918)
Simply Wall St Financial Health Rating: ★★★★☆☆
Overview: NagaCorp Ltd. is an investment holding company that manages and operates a hotel and casino complex in the Kingdom of Cambodia, with a market cap of HK$14.15 billion.
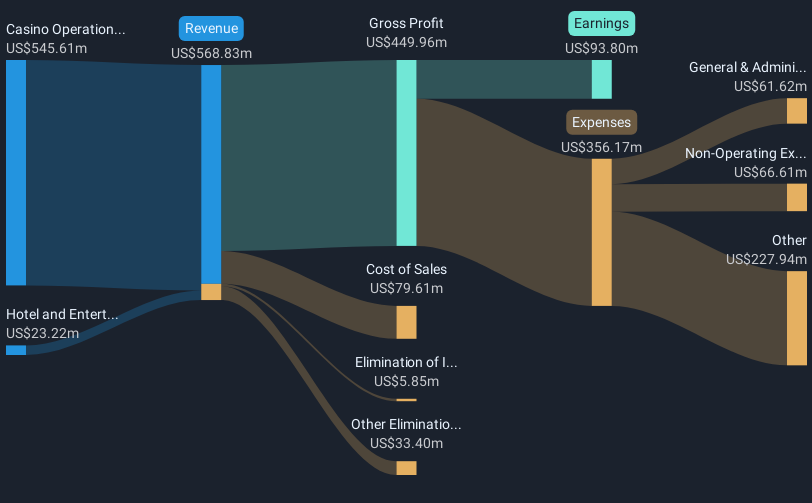
Operations: The company's revenue is primarily derived from casino operations, generating $545.61 million, complemented by hotel and entertainment operations contributing $23.22 million.
Market Cap: HK$14.15B
NagaCorp Ltd. faces challenges with declining earnings, which have decreased by 36.2% annually over the past five years, and a reduction in profit margins from 30% to 17.7%. Despite these hurdles, it maintains a satisfactory net debt to equity ratio of 22.2%, and its interest payments are well-covered by EBIT at 9.1 times coverage. The company's short-term assets of $598.2M fall short of covering its short-term liabilities of $681M, indicating liquidity concerns. Recent board changes include the appointment of Ms. Sophie Lam as Company Secretary, bringing over two decades of governance experience to the team.
- Click here and access our complete financial health analysis report to understand the dynamics of NagaCorp.
- Gain insights into NagaCorp's outlook and expected performance with our report on the company's earnings estimates.
Sheng Siong Group (SGX:OV8)
Simply Wall St Financial Health Rating: ★★★★★★
Overview: Sheng Siong Group Ltd is an investment holding company that operates a chain of supermarket retail stores in Singapore, with a market cap of SGD2.47 billion.
Operations: The company's revenue is primarily derived from its supermarket operations, selling consumer goods, which generated SGD1.43 billion.
Market Cap: SGD2.47B
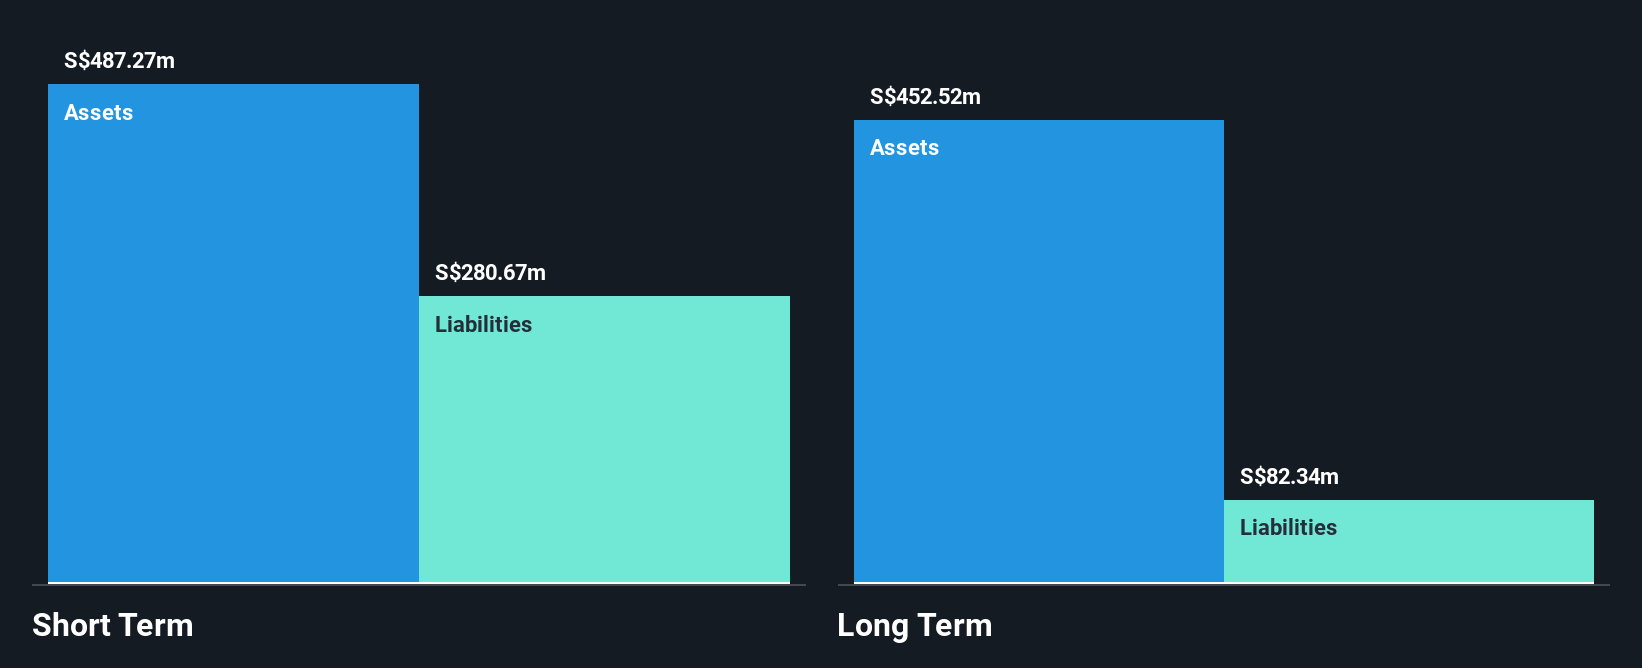
Sheng Siong Group Ltd demonstrates stability with a market cap of SGD2.47 billion and consistent revenue growth, reporting sales of SGD1.43 billion for 2024, up from the previous year. The company boasts high-quality earnings with a Return on Equity of 25.5% and operates debt-free, mitigating interest payment concerns. Its seasoned management team has an average tenure of 7.8 years, enhancing operational effectiveness. Although profit margins slightly decreased to 9.6%, short-term assets significantly exceed liabilities, ensuring liquidity strength. Despite slower recent earnings growth at 2.9%, forecasts suggest a steady increase in profitability moving forward.
- Navigate through the intricacies of Sheng Siong Group with our comprehensive balance sheet health report here.
- Understand Sheng Siong Group's earnings outlook by examining our growth report.
Seize The Opportunity
- Dive into all 1,171 of the Asian Penny Stocks we have identified here.
- Are any of these part of your asset mix? Tap into the analytical power of Simply Wall St's portfolio to get a 360-degree view on how they're shaping up.
- Simply Wall St is a revolutionary app designed for long-term stock investors, it's free and covers every market in the world.
Ready For A Different Approach?
- Explore high-performing small cap companies that haven't yet garnered significant analyst attention.
- Jump on the AI train with fast growing tech companies forging a new era of innovation.
- Find companies with promising cash flow potential yet trading below their fair value.
This article by Simply Wall St is general in nature. We provide commentary based on historical data and analyst forecasts only using an unbiased methodology and our articles are not intended to be financial advice. It does not constitute a recommendation to buy or sell any stock, and does not take account of your objectives, or your financial situation. We aim to bring you long-term focused analysis driven by fundamental data. Note that our analysis may not factor in the latest price-sensitive company announcements or qualitative material. Simply Wall St has no position in any stocks mentioned.
Have feedback on this article? Concerned about the content? Get in touch with us directly. Alternatively, email editorial-team@simplywallst.com