
NetDragon Websoft Holdings Limited (HKG:777) shareholders should be happy to see the share price up 13% in the last month. But over the last half decade, the stock has not performed well. In fact, the share price is down 44%, which falls well short of the return you could get by buying an index fund.
If the past week is anything to go by, investor sentiment for NetDragon Websoft Holdings isn't positive, so let's see if there's a mismatch between fundamentals and the share price.
See our latest analysis for NetDragon Websoft Holdings
To paraphrase Benjamin Graham: Over the short term the market is a voting machine, but over the long term it's a weighing machine. One flawed but reasonable way to assess how sentiment around a company has changed is to compare the earnings per share (EPS) with the share price.
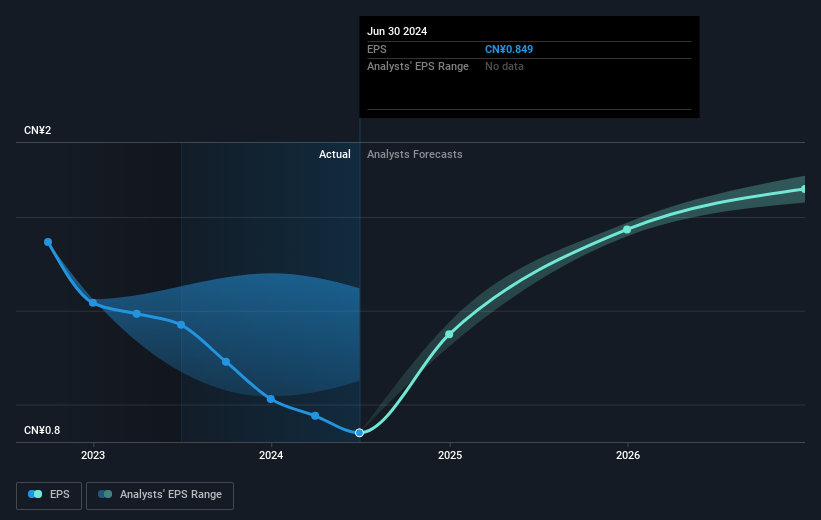
Looking back five years, both NetDragon Websoft Holdings' share price and EPS declined; the latter at a rate of 10% per year. This change in EPS is reasonably close to the 11% average annual decrease in the share price. That suggests that the market sentiment around the company hasn't changed much over that time. Rather, the share price change has reflected changes in earnings per share.
The graphic below depicts how EPS has changed over time (unveil the exact values by clicking on the image).
It's probably worth noting that the CEO is paid less than the median at similar sized companies. But while CEO remuneration is always worth checking, the really important question is whether the company can grow earnings going forward. This free interactive report on NetDragon Websoft Holdings' earnings, revenue and cash flow is a great place to start, if you want to investigate the stock further.
What About Dividends?
As well as measuring the share price return, investors should also consider the total shareholder return (TSR). Whereas the share price return only reflects the change in the share price, the TSR includes the value of dividends (assuming they were reinvested) and the benefit of any discounted capital raising or spin-off. It's fair to say that the TSR gives a more complete picture for stocks that pay a dividend. We note that for NetDragon Websoft Holdings the TSR over the last 5 years was -15%, which is better than the share price return mentioned above. This is largely a result of its dividend payments!
A Different Perspective
NetDragon Websoft Holdings provided a TSR of 8.7% over the last twelve months. Unfortunately this falls short of the market return. But at least that's still a gain! Over five years the TSR has been a reduction of 3% per year, over five years. So this might be a sign the business has turned its fortunes around. It's always interesting to track share price performance over the longer term. But to understand NetDragon Websoft Holdings better, we need to consider many other factors. To that end, you should be aware of the 2 warning signs we've spotted with NetDragon Websoft Holdings .
But note: NetDragon Websoft Holdings may not be the best stock to buy. So take a peek at this free list of interesting companies with past earnings growth (and further growth forecast).
Please note, the market returns quoted in this article reflect the market weighted average returns of stocks that currently trade on Hong Kong exchanges.
Have feedback on this article? Concerned about the content? Get in touch with us directly. Alternatively, email editorial-team (at) simplywallst.com.
This article by Simply Wall St is general in nature. We provide commentary based on historical data and analyst forecasts only using an unbiased methodology and our articles are not intended to be financial advice. It does not constitute a recommendation to buy or sell any stock, and does not take account of your objectives, or your financial situation. We aim to bring you long-term focused analysis driven by fundamental data. Note that our analysis may not factor in the latest price-sensitive company announcements or qualitative material. Simply Wall St has no position in any stocks mentioned.