
Amidst a backdrop of global economic uncertainties, the Asian markets have displayed resilience, with investors closely monitoring developments in China and Japan as they navigate trade tensions and inflationary pressures. In this environment, identifying undervalued stocks can offer potential opportunities for investors seeking to capitalize on discrepancies between market price and intrinsic value.
Top 10 Undervalued Stocks Based On Cash Flows In Asia
| Name | Current Price | Fair Value (Est) | Discount (Est) |
| Wiwynn (TWSE:6669) | NT$1920.00 | NT$3781.24 | 49.2% |
| Chifeng Jilong Gold MiningLtd (SHSE:600988) | CN¥18.16 | CN¥36.02 | 49.6% |
| Shenzhou International Group Holdings (SEHK:2313) | HK$57.10 | HK$114.14 | 50% |
| RACCOON HOLDINGS (TSE:3031) | ¥965.00 | ¥1903.17 | 49.3% |
| Hyosung Heavy Industries (KOSE:A298040) | ₩432500.00 | ₩855375.21 | 49.4% |
| LITALICO (TSE:7366) | ¥1081.00 | ¥2155.11 | 49.8% |
| CREAL (TSE:2998) | ¥3460.00 | ¥6806.25 | 49.2% |
| Nanjing King-Friend Biochemical PharmaceuticalLtd (SHSE:603707) | CN¥12.50 | CN¥24.90 | 49.8% |
| Sunny Optical Technology (Group) (SEHK:2382) | HK$84.65 | HK$168.45 | 49.7% |
| Nanofilm Technologies International (SGX:MZH) | SGD0.67 | SGD1.32 | 49.2% |
Below we spotlight a couple of our favorites from our exclusive screener.
Techtronic Industries (SEHK:669)
Overview: Techtronic Industries Company Limited designs, manufactures, and markets power tools, outdoor power equipment, and floorcare and cleaning products globally, with a market cap of approximately HK$204.12 billion.
Operations: The company's revenue is primarily derived from its Power Equipment segment, which accounts for $13.23 billion, followed by the Floorcare & Cleaning segment at $965.09 million.
Estimated Discount To Fair Value: 17.3%
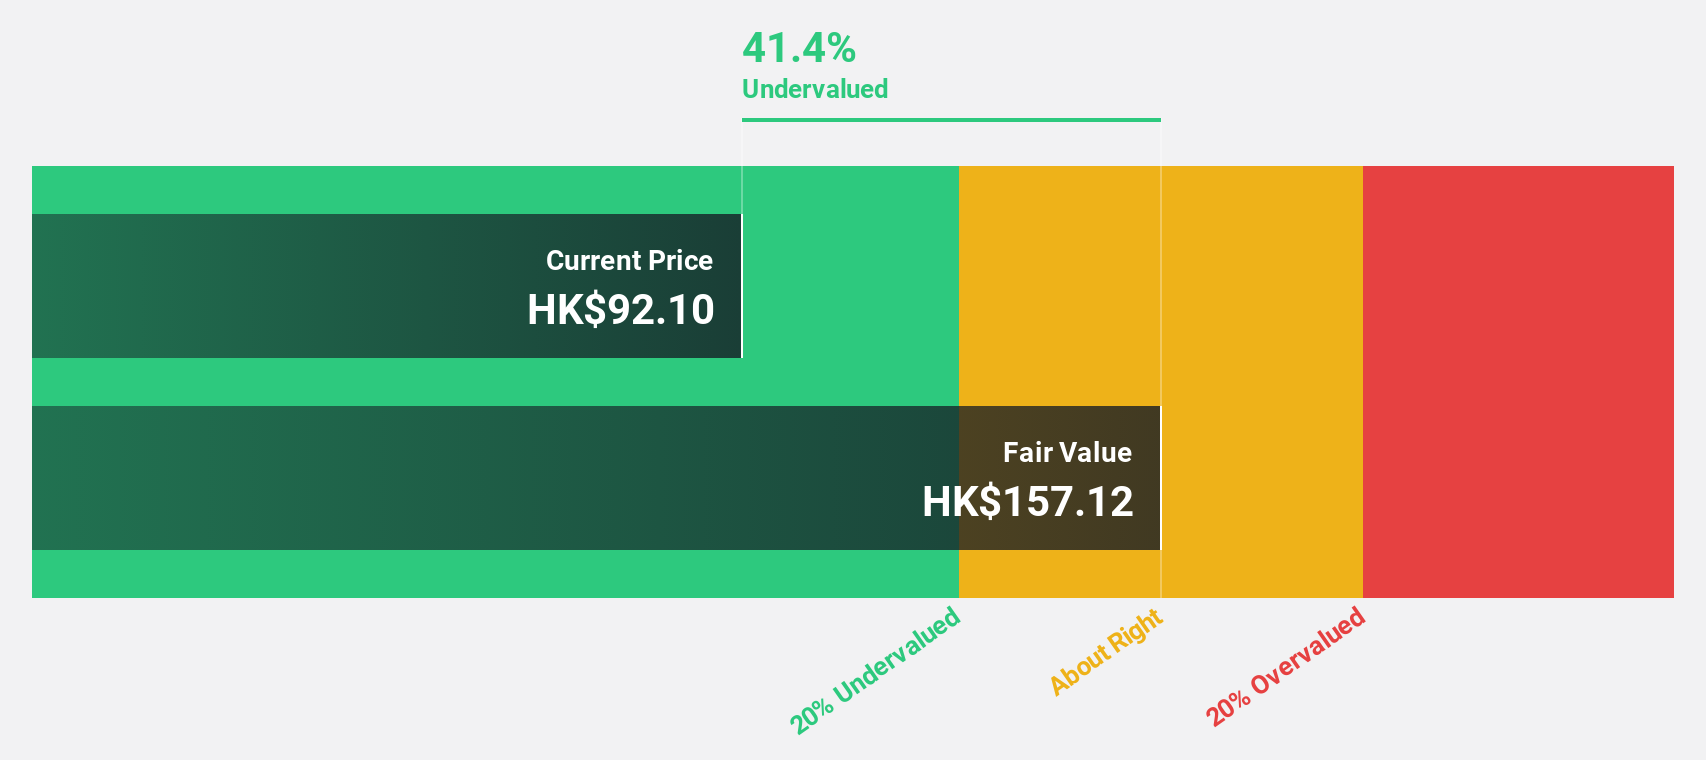
Techtronic Industries, trading at HK$111.4, is considered undervalued based on its discounted cash flow valuation with an estimated fair value of HK$134.73. The company's earnings are projected to grow at 15.9% annually, outpacing the Hong Kong market's 11.6%. Despite slower revenue growth forecasts of 8.5%, Techtronic's strong return on equity forecast of 20% in three years underscores its potential as a solid investment opportunity in Asia's undervalued stocks landscape.
- Upon reviewing our latest growth report, Techtronic Industries' projected financial performance appears quite optimistic.
- Delve into the full analysis health report here for a deeper understanding of Techtronic Industries.
Treasure FactoryLTD (TSE:3093)
Overview: Treasure Factory Co., LTD., along with its subsidiaries, operates reuse stores in Japan and has a market cap of ¥39.19 billion.
Operations: The company generates revenue through its reuse store operations in Japan.
Estimated Discount To Fair Value: 20.6%
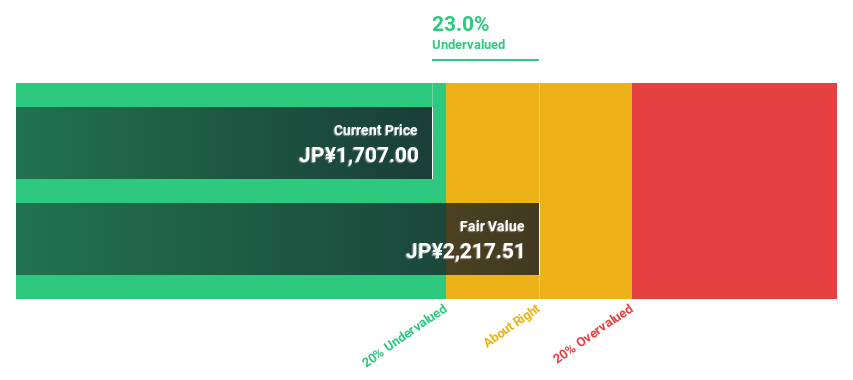
Treasure Factory Co., LTD. is trading at ¥1672, below its estimated fair value of ¥2106.79, making it undervalued based on discounted cash flow analysis. Recent sales results show strong growth with January 2025 net sales up significantly from the previous year. Earnings are forecast to grow 10% annually, outpacing Japan's market average of 8%. However, the company has a high level of debt and an unstable dividend track record amidst share price volatility.
- Our growth report here indicates Treasure FactoryLTD may be poised for an improving outlook.
- Click here to discover the nuances of Treasure FactoryLTD with our detailed financial health report.
Relo Group (TSE:8876)
Overview: Relo Group, Inc. provides property management services in Japan and has a market capitalization of ¥294.72 billion.
Operations: The company's revenue is primarily derived from its Relocation Business at ¥99.73 billion, followed by the Fringe Benefit Business at ¥27.13 billion and the Tourism Business at ¥15.66 billion.
Estimated Discount To Fair Value: 26.4%
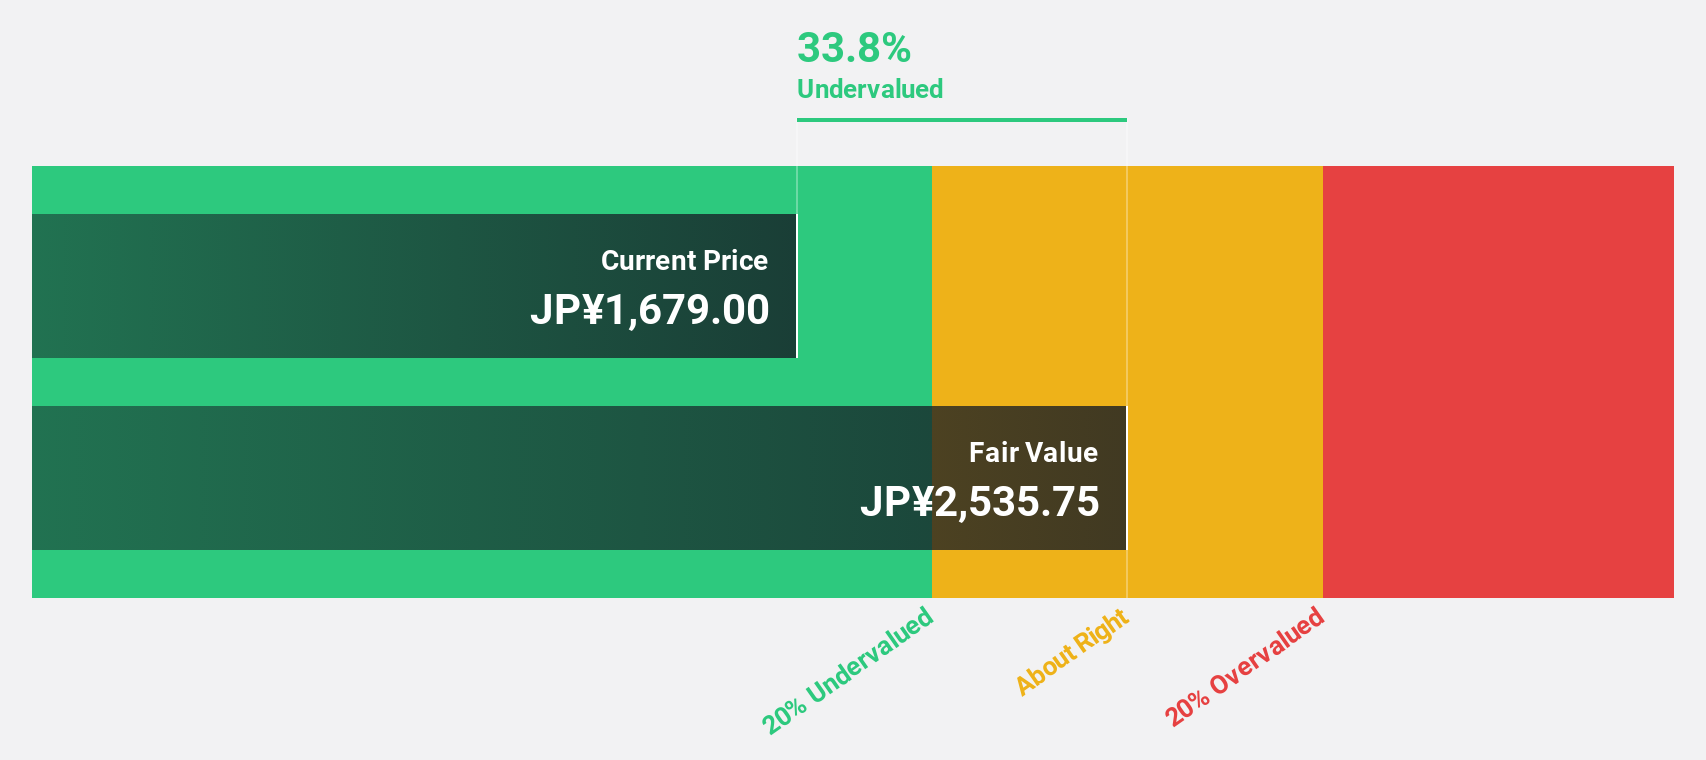
Relo Group is trading at ¥1969, significantly below its estimated fair value of ¥2674.57, indicating undervaluation based on cash flows. The company forecasts a revenue of ¥140 billion and an operating profit of ¥30 billion for the fiscal year ending March 2025. Earnings are expected to grow at 16.12% annually, surpassing the market average, though its dividend yield of 1.93% is not well covered by earnings.
- The analysis detailed in our Relo Group growth report hints at robust future financial performance.
- Get an in-depth perspective on Relo Group's balance sheet by reading our health report here.
Summing It All Up
- Click through to start exploring the rest of the 285 Undervalued Asian Stocks Based On Cash Flows now.
- Shareholder in one or more of these companies? Ensure you're never caught off-guard by adding your portfolio in Simply Wall St for timely alerts on significant stock developments.
- Elevate your portfolio with Simply Wall St, the ultimate app for investors seeking global market coverage.
Interested In Other Possibilities?
- Explore high-performing small cap companies that haven't yet garnered significant analyst attention.
- Diversify your portfolio with solid dividend payers offering reliable income streams to weather potential market turbulence.
- Fuel your portfolio with companies showing strong growth potential, backed by optimistic outlooks both from analysts and management.
This article by Simply Wall St is general in nature. We provide commentary based on historical data and analyst forecasts only using an unbiased methodology and our articles are not intended to be financial advice. It does not constitute a recommendation to buy or sell any stock, and does not take account of your objectives, or your financial situation. We aim to bring you long-term focused analysis driven by fundamental data. Note that our analysis may not factor in the latest price-sensitive company announcements or qualitative material. Simply Wall St has no position in any stocks mentioned.
Have feedback on this article? Concerned about the content? Get in touch with us directly. Alternatively, email editorial-team@simplywallst.com