
V & V Technology Holdings Limited (HKG:8113) shares have continued their recent momentum with a 30% gain in the last month alone. Notwithstanding the latest gain, the annual share price return of 5.7% isn't as impressive.
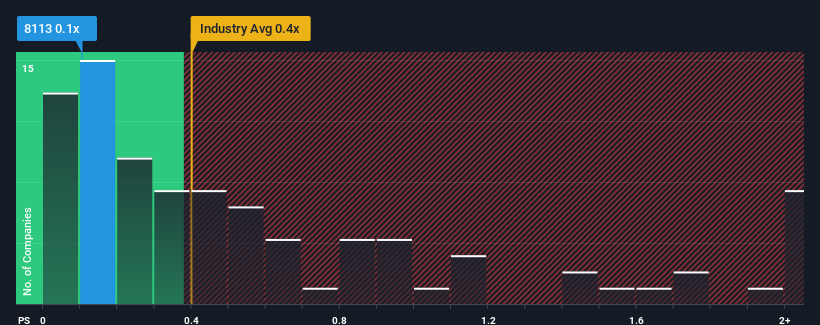
In spite of the firm bounce in price, it's still not a stretch to say that V & V Technology Holdings' price-to-sales (or "P/S") ratio of 0.1x right now seems quite "middle-of-the-road" compared to the Electronic industry in Hong Kong, where the median P/S ratio is around 0.4x. However, investors might be overlooking a clear opportunity or potential setback if there is no rational basis for the P/S.
View our latest analysis for V & V Technology Holdings
What Does V & V Technology Holdings' Recent Performance Look Like?
For example, consider that V & V Technology Holdings' financial performance has been poor lately as its revenue has been in decline. Perhaps investors believe the recent revenue performance is enough to keep in line with the industry, which is keeping the P/S from dropping off. If you like the company, you'd at least be hoping this is the case so that you could potentially pick up some stock while it's not quite in favour.
We don't have analyst forecasts, but you can see how recent trends are setting up the company for the future by checking out our free report on V & V Technology Holdings' earnings, revenue and cash flow.How Is V & V Technology Holdings' Revenue Growth Trending?
In order to justify its P/S ratio, V & V Technology Holdings would need to produce growth that's similar to the industry.
Taking a look back first, the company's revenue growth last year wasn't something to get excited about as it posted a disappointing decline of 24%. The last three years don't look nice either as the company has shrunk revenue by 64% in aggregate. Accordingly, shareholders would have felt downbeat about the medium-term rates of revenue growth.
Weighing that medium-term revenue trajectory against the broader industry's one-year forecast for expansion of 23% shows it's an unpleasant look.
With this information, we find it concerning that V & V Technology Holdings is trading at a fairly similar P/S compared to the industry. It seems most investors are ignoring the recent poor growth rate and are hoping for a turnaround in the company's business prospects. There's a good chance existing shareholders are setting themselves up for future disappointment if the P/S falls to levels more in line with the recent negative growth rates.
What Does V & V Technology Holdings' P/S Mean For Investors?
V & V Technology Holdings appears to be back in favour with a solid price jump bringing its P/S back in line with other companies in the industry It's argued the price-to-sales ratio is an inferior measure of value within certain industries, but it can be a powerful business sentiment indicator.
The fact that V & V Technology Holdings currently trades at a P/S on par with the rest of the industry is surprising to us since its recent revenues have been in decline over the medium-term, all while the industry is set to grow. Even though it matches the industry, we're uncomfortable with the current P/S ratio, as this dismal revenue performance is unlikely to support a more positive sentiment for long. If recent medium-term revenue trends continue, it will place shareholders' investments at risk and potential investors in danger of paying an unnecessary premium.
Having said that, be aware V & V Technology Holdings is showing 5 warning signs in our investment analysis, and 3 of those make us uncomfortable.
Of course, profitable companies with a history of great earnings growth are generally safer bets. So you may wish to see this free collection of other companies that have reasonable P/E ratios and have grown earnings strongly.
Have feedback on this article? Concerned about the content? Get in touch with us directly. Alternatively, email editorial-team (at) simplywallst.com.
This article by Simply Wall St is general in nature. We provide commentary based on historical data and analyst forecasts only using an unbiased methodology and our articles are not intended to be financial advice. It does not constitute a recommendation to buy or sell any stock, and does not take account of your objectives, or your financial situation. We aim to bring you long-term focused analysis driven by fundamental data. Note that our analysis may not factor in the latest price-sensitive company announcements or qualitative material. Simply Wall St has no position in any stocks mentioned.