
Tian Chang Group Holdings Ltd. (HKG:2182) shareholders would be excited to see that the share price has had a great month, posting a 29% gain and recovering from prior weakness. Unfortunately, the gains of the last month did little to right the losses of the last year with the stock still down 20% over that time.
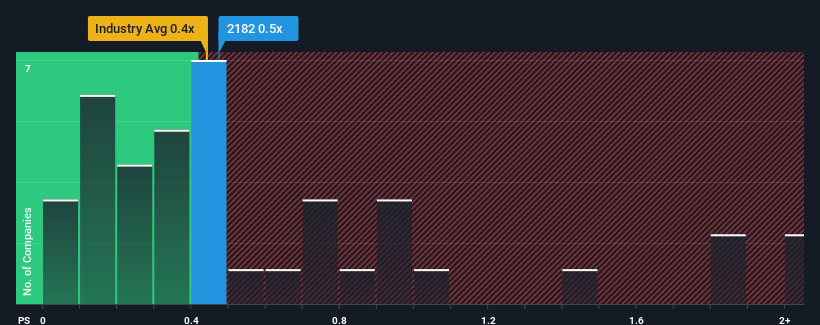
Even after such a large jump in price, you could still be forgiven for feeling indifferent about Tian Chang Group Holdings' P/S ratio of 0.5x, since the median price-to-sales (or "P/S") ratio for the Chemicals industry in Hong Kong is also close to 0.4x. However, investors might be overlooking a clear opportunity or potential setback if there is no rational basis for the P/S.
See our latest analysis for Tian Chang Group Holdings
What Does Tian Chang Group Holdings' P/S Mean For Shareholders?
As an illustration, revenue has deteriorated at Tian Chang Group Holdings over the last year, which is not ideal at all. It might be that many expect the company to put the disappointing revenue performance behind them over the coming period, which has kept the P/S from falling. If not, then existing shareholders may be a little nervous about the viability of the share price.
We don't have analyst forecasts, but you can see how recent trends are setting up the company for the future by checking out our free report on Tian Chang Group Holdings' earnings, revenue and cash flow.Is There Some Revenue Growth Forecasted For Tian Chang Group Holdings?
In order to justify its P/S ratio, Tian Chang Group Holdings would need to produce growth that's similar to the industry.
Taking a look back first, the company's revenue growth last year wasn't something to get excited about as it posted a disappointing decline of 46%. The last three years don't look nice either as the company has shrunk revenue by 46% in aggregate. Accordingly, shareholders would have felt downbeat about the medium-term rates of revenue growth.
In contrast to the company, the rest of the industry is expected to grow by 4.8% over the next year, which really puts the company's recent medium-term revenue decline into perspective.
With this information, we find it concerning that Tian Chang Group Holdings is trading at a fairly similar P/S compared to the industry. Apparently many investors in the company are way less bearish than recent times would indicate and aren't willing to let go of their stock right now. Only the boldest would assume these prices are sustainable as a continuation of recent revenue trends is likely to weigh on the share price eventually.
The Final Word
Its shares have lifted substantially and now Tian Chang Group Holdings' P/S is back within range of the industry median. Generally, our preference is to limit the use of the price-to-sales ratio to establishing what the market thinks about the overall health of a company.
We find it unexpected that Tian Chang Group Holdings trades at a P/S ratio that is comparable to the rest of the industry, despite experiencing declining revenues during the medium-term, while the industry as a whole is expected to grow. When we see revenue heading backwards in the context of growing industry forecasts, it'd make sense to expect a possible share price decline on the horizon, sending the moderate P/S lower. Unless the recent medium-term conditions improve markedly, investors will have a hard time accepting the share price as fair value.
Before you settle on your opinion, we've discovered 4 warning signs for Tian Chang Group Holdings (1 is concerning!) that you should be aware of.
It's important to make sure you look for a great company, not just the first idea you come across. So if growing profitability aligns with your idea of a great company, take a peek at this free list of interesting companies with strong recent earnings growth (and a low P/E).
Have feedback on this article? Concerned about the content? Get in touch with us directly. Alternatively, email editorial-team (at) simplywallst.com.
This article by Simply Wall St is general in nature. We provide commentary based on historical data and analyst forecasts only using an unbiased methodology and our articles are not intended to be financial advice. It does not constitute a recommendation to buy or sell any stock, and does not take account of your objectives, or your financial situation. We aim to bring you long-term focused analysis driven by fundamental data. Note that our analysis may not factor in the latest price-sensitive company announcements or qualitative material. Simply Wall St has no position in any stocks mentioned.