
As global markets navigate a mix of steady interest rates, fluctuating corporate earnings, and geopolitical uncertainties, investors are seeking opportunities in less conventional areas. Penny stocks, often seen as relics from past market eras, continue to offer intriguing possibilities for those willing to explore beyond the mainstream. These typically smaller or newer companies provide a blend of affordability and potential growth when backed by robust financial health.
Top 10 Penny Stocks
| Name | Share Price | Market Cap | Financial Health Rating |
| Bosideng International Holdings (SEHK:3998) | HK$3.73 | HK$42.97B | ★★★★★★ |
| DXN Holdings Bhd (KLSE:DXN) | MYR0.535 | MYR2.64B | ★★★★★★ |
| Polar Capital Holdings (AIM:POLR) | £4.905 | £468.49M | ★★★★★★ |
| Foresight Group Holdings (LSE:FSG) | £3.80 | £455.09M | ★★★★★★ |
| Tristel (AIM:TSTL) | £3.70 | £174.08M | ★★★★★★ |
| Datasonic Group Berhad (KLSE:DSONIC) | MYR0.395 | MYR1.1B | ★★★★★★ |
| Hil Industries Berhad (KLSE:HIL) | MYR0.85 | MYR292.11M | ★★★★★★ |
| MGB Berhad (KLSE:MGB) | MYR0.695 | MYR414.16M | ★★★★★★ |
| Embark Early Education (ASX:EVO) | A$0.775 | A$143.12M | ★★★★☆☆ |
| Helios Underwriting (AIM:HUW) | £2.23 | £158.38M | ★★★★★☆ |
Click here to see the full list of 5,707 stocks from our Penny Stocks screener.
Here's a peek at a few of the choices from the screener.
Viva Biotech Holdings (SEHK:1873)
Simply Wall St Financial Health Rating: ★★★★☆☆
Overview: Viva Biotech Holdings is an investment holding company that provides structure-based drug discovery services to biotechnology and pharmaceutical clients globally, with a market capitalization of approximately HK$1.69 billion.
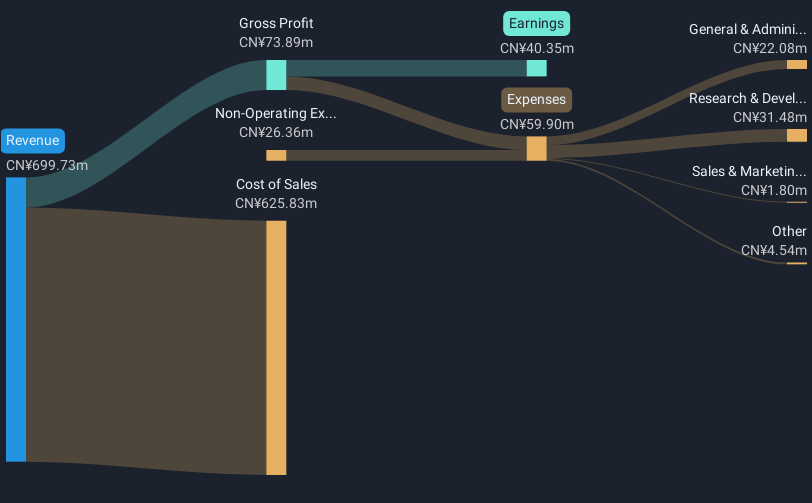
Operations: The company generates revenue primarily from Drug Discovery Services, amounting to CN¥780.09 million, and Contract Development Manufacture Organisation (CDMO) and Commercialisation Services, contributing CN¥1.21 billion.
Market Cap: HK$1.69B
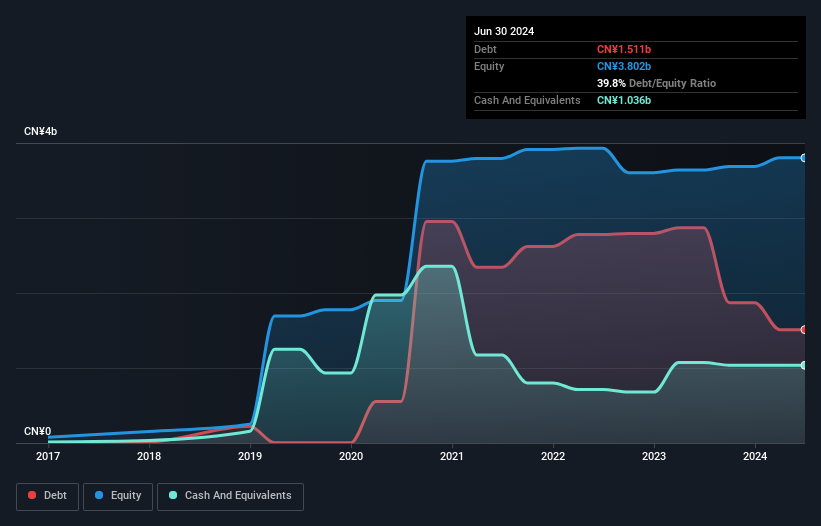
Viva Biotech Holdings, with a market cap of approximately HK$1.69 billion, is navigating the challenges typical of smaller stocks by leveraging its global presence and expanding operations. The establishment of a new branch in Boston enhances its strategic positioning within the biopharmaceutical industry. Despite being unprofitable, Viva maintains a positive cash flow and has sufficient runway for over three years, supported by CN¥1.9 billion in short-term assets exceeding short-term liabilities. However, increasing debt levels and negative return on equity highlight financial risks that investors should consider alongside growth potential from international expansion efforts.
- Click here and access our complete financial health analysis report to understand the dynamics of Viva Biotech Holdings.
- Explore historical data to track Viva Biotech Holdings' performance over time in our past results report.
Jiangsu Jiangnan High Polymer FiberLtd (SHSE:600527)
Simply Wall St Financial Health Rating: ★★★★★☆
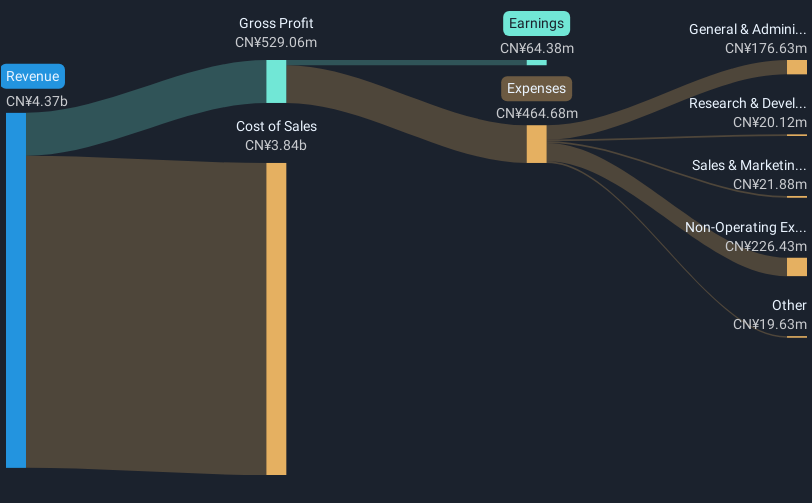
Overview: Jiangsu Jiangnan High Polymer Fiber Co., Ltd specializes in the production and sale of composite short-fibers and polyester tops, serving both domestic and international markets, with a market capitalization of CN¥3.64 billion.
Operations: Jiangsu Jiangnan High Polymer Fiber Co., Ltd has not reported specific revenue segments.
Market Cap: CN¥3.64B
Jiangsu Jiangnan High Polymer Fiber Co., Ltd, with a market cap of CN¥3.64 billion, showcases a solid balance sheet where short-term assets of CN¥1.2 billion comfortably cover both short-term and long-term liabilities. Despite low return on equity at 1.9% and declining earnings growth over the past year, the company's debt is well covered by operating cash flow at 1274.9%, indicating strong liquidity management. However, profit margins have decreased to 5.8% from last year's 8%, and its dividend of 2.28% is not well supported by earnings or free cash flows, posing potential risks for investors seeking stable returns amidst high share price volatility.
- Dive into the specifics of Jiangsu Jiangnan High Polymer FiberLtd here with our thorough balance sheet health report.
- Understand Jiangsu Jiangnan High Polymer FiberLtd's track record by examining our performance history report.
Top Resource Energy (SZSE:300332)
Simply Wall St Financial Health Rating: ★★★★★☆
Overview: Top Resource Energy Co., Ltd. operates in the natural gas sector, focusing on trading, pipeline transportation, urban gas transmission and distribution, gas engineering design, and technical services, with a market cap of CN¥4.21 billion.
Operations: Top Resource Energy Co., Ltd. has not reported specific revenue segments, but its operations are centered around the natural gas industry, including trading, pipeline transportation, urban gas transmission and distribution, engineering design, and technical services.
Market Cap: CN¥4.21B
Top Resource Energy Co., Ltd., with a market cap of CN¥4.21 billion, is involved in the natural gas sector and faces several challenges typical of its category. The company's return on equity is low at 2.4%, and profit margins have decreased to 1.5% from last year's 9.1%. Despite these setbacks, it trades significantly below estimated fair value and maintains satisfactory debt levels with a net debt to equity ratio of 4.8%. While earnings are forecasted to grow substantially by over half annually, the management team lacks extensive experience, averaging just over one year in tenure.
- Click to explore a detailed breakdown of our findings in Top Resource Energy's financial health report.
- Gain insights into Top Resource Energy's future direction by reviewing our growth report.
Key Takeaways
- Click through to start exploring the rest of the 5,704 Penny Stocks now.
- Have you diversified into these companies? Leverage the power of Simply Wall St's portfolio to keep a close eye on market movements affecting your investments.
- Elevate your portfolio with Simply Wall St, the ultimate app for investors seeking global market coverage.
Searching for a Fresh Perspective?
- Explore high-performing small cap companies that haven't yet garnered significant analyst attention.
- Jump on the AI train with fast growing tech companies forging a new era of innovation.
- Find companies with promising cash flow potential yet trading below their fair value.
This article by Simply Wall St is general in nature. We provide commentary based on historical data and analyst forecasts only using an unbiased methodology and our articles are not intended to be financial advice. It does not constitute a recommendation to buy or sell any stock, and does not take account of your objectives, or your financial situation. We aim to bring you long-term focused analysis driven by fundamental data. Note that our analysis may not factor in the latest price-sensitive company announcements or qualitative material. Simply Wall St has no position in any stocks mentioned.
Have feedback on this article? Concerned about the content? Get in touch with us directly. Alternatively, email editorial-team@simplywallst.com