
When we invest, we're generally looking for stocks that outperform the market average. Buying under-rated businesses is one path to excess returns. For example, long term Huaneng Power International, Inc. (HKG:902) shareholders have enjoyed a 14% share price rise over the last half decade, well in excess of the market decline of around 5.8% (not including dividends).
Now it's worth having a look at the company's fundamentals too, because that will help us determine if the long term shareholder return has matched the performance of the underlying business.
See our latest analysis for Huaneng Power International
While the efficient markets hypothesis continues to be taught by some, it has been proven that markets are over-reactive dynamic systems, and investors are not always rational. By comparing earnings per share (EPS) and share price changes over time, we can get a feel for how investor attitudes to a company have morphed over time.
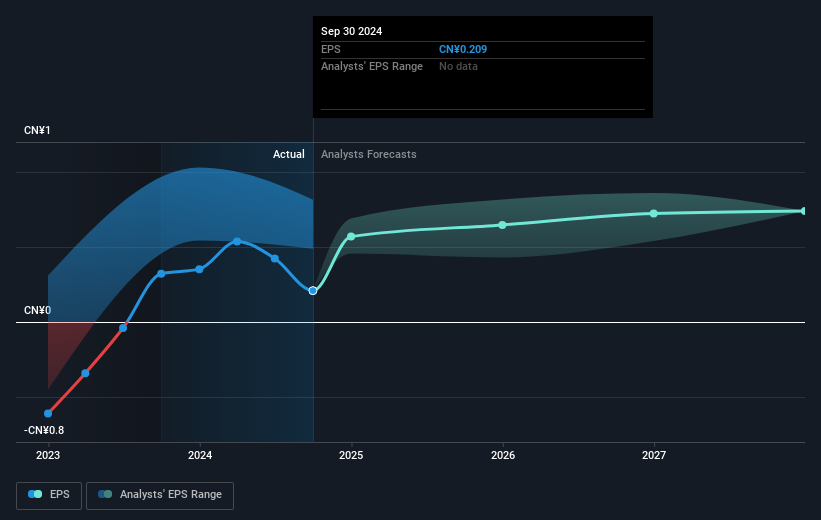
During the last half decade, Huaneng Power International became profitable. That's generally thought to be a genuine positive, so investors may expect to see an increasing share price.
The company's earnings per share (over time) is depicted in the image below (click to see the exact numbers).
We're pleased to report that the CEO is remunerated more modestly than most CEOs at similarly capitalized companies. But while CEO remuneration is always worth checking, the really important question is whether the company can grow earnings going forward. Dive deeper into the earnings by checking this interactive graph of Huaneng Power International's earnings, revenue and cash flow.
What About Dividends?
As well as measuring the share price return, investors should also consider the total shareholder return (TSR). The TSR is a return calculation that accounts for the value of cash dividends (assuming that any dividend received was reinvested) and the calculated value of any discounted capital raisings and spin-offs. Arguably, the TSR gives a more comprehensive picture of the return generated by a stock. As it happens, Huaneng Power International's TSR for the last 5 years was 35%, which exceeds the share price return mentioned earlier. This is largely a result of its dividend payments!
A Different Perspective
While the broader market gained around 31% in the last year, Huaneng Power International shareholders lost 0.7% (even including dividends). Even the share prices of good stocks drop sometimes, but we want to see improvements in the fundamental metrics of a business, before getting too interested. On the bright side, long term shareholders have made money, with a gain of 6% per year over half a decade. It could be that the recent sell-off is an opportunity, so it may be worth checking the fundamental data for signs of a long term growth trend. It's always interesting to track share price performance over the longer term. But to understand Huaneng Power International better, we need to consider many other factors. Take risks, for example - Huaneng Power International has 4 warning signs (and 2 which are concerning) we think you should know about.
For those who like to find winning investments this free list of undervalued companies with recent insider purchasing, could be just the ticket.
Please note, the market returns quoted in this article reflect the market weighted average returns of stocks that currently trade on Hong Kong exchanges.
Have feedback on this article? Concerned about the content? Get in touch with us directly. Alternatively, email editorial-team (at) simplywallst.com.
This article by Simply Wall St is general in nature. We provide commentary based on historical data and analyst forecasts only using an unbiased methodology and our articles are not intended to be financial advice. It does not constitute a recommendation to buy or sell any stock, and does not take account of your objectives, or your financial situation. We aim to bring you long-term focused analysis driven by fundamental data. Note that our analysis may not factor in the latest price-sensitive company announcements or qualitative material. Simply Wall St has no position in any stocks mentioned.