
It is hard to get excited after looking at Rego Interactive's (HKG:2422) recent performance, when its stock has declined 19% over the past month. We, however decided to study the company's financials to determine if they have got anything to do with the price decline. Fundamentals usually dictate market outcomes so it makes sense to study the company's financials. In this article, we decided to focus on Rego Interactive's ROE.
Return on Equity or ROE is a test of how effectively a company is growing its value and managing investors’ money. In simpler terms, it measures the profitability of a company in relation to shareholder's equity.
Check out our latest analysis for Rego Interactive
How Is ROE Calculated?
ROE can be calculated by using the formula:
Return on Equity = Net Profit (from continuing operations) ÷ Shareholders' Equity
So, based on the above formula, the ROE for Rego Interactive is:
1.0% = CN¥3.8m ÷ CN¥399m (Based on the trailing twelve months to June 2024).
The 'return' is the income the business earned over the last year. That means that for every HK$1 worth of shareholders' equity, the company generated HK$0.01 in profit.
Why Is ROE Important For Earnings Growth?
Thus far, we have learned that ROE measures how efficiently a company is generating its profits. We now need to evaluate how much profit the company reinvests or "retains" for future growth which then gives us an idea about the growth potential of the company. Assuming everything else remains unchanged, the higher the ROE and profit retention, the higher the growth rate of a company compared to companies that don't necessarily bear these characteristics.
Rego Interactive's Earnings Growth And 1.0% ROE
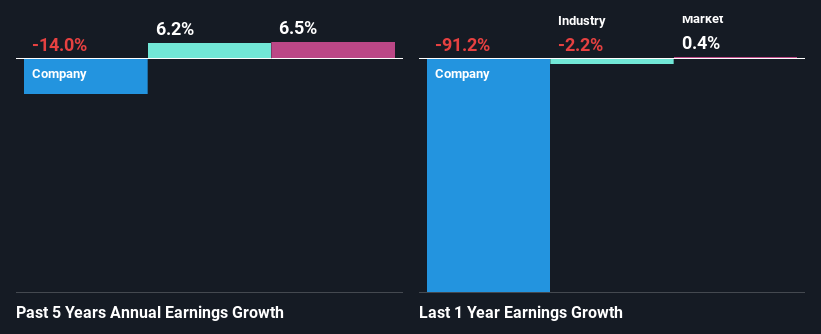
It is quite clear that Rego Interactive's ROE is rather low. Not just that, even compared to the industry average of 9.1%, the company's ROE is entirely unremarkable. Therefore, it might not be wrong to say that the five year net income decline of 14% seen by Rego Interactive was possibly a result of it having a lower ROE. We believe that there also might be other aspects that are negatively influencing the company's earnings prospects. For instance, the company has a very high payout ratio, or is faced with competitive pressures.
However, when we compared Rego Interactive's growth with the industry we found that while the company's earnings have been shrinking, the industry has seen an earnings growth of 6.2% in the same period. This is quite worrisome.
The basis for attaching value to a company is, to a great extent, tied to its earnings growth. It’s important for an investor to know whether the market has priced in the company's expected earnings growth (or decline). By doing so, they will have an idea if the stock is headed into clear blue waters or if swampy waters await. Is Rego Interactive fairly valued compared to other companies? These 3 valuation measures might help you decide.
Is Rego Interactive Using Its Retained Earnings Effectively?
Because Rego Interactive doesn't pay any regular dividends, we infer that it is retaining all of its profits, which is rather perplexing when you consider the fact that there is no earnings growth to show for it. It looks like there might be some other reasons to explain the lack in that respect. For example, the business could be in decline.
Conclusion
Overall, we have mixed feelings about Rego Interactive. While the company does have a high rate of profit retention, its low rate of return is probably hampering its earnings growth. Wrapping up, we would proceed with caution with this company and one way of doing that would be to look at the risk profile of the business. You can see the 4 risks we have identified for Rego Interactive by visiting our risks dashboard for free on our platform here.
Have feedback on this article? Concerned about the content? Get in touch with us directly. Alternatively, email editorial-team (at) simplywallst.com.
This article by Simply Wall St is general in nature. We provide commentary based on historical data and analyst forecasts only using an unbiased methodology and our articles are not intended to be financial advice. It does not constitute a recommendation to buy or sell any stock, and does not take account of your objectives, or your financial situation. We aim to bring you long-term focused analysis driven by fundamental data. Note that our analysis may not factor in the latest price-sensitive company announcements or qualitative material. Simply Wall St has no position in any stocks mentioned.