
As global markets navigate a period of mixed economic signals, with U.S. consumer confidence declining and European stocks experiencing moderate gains, investors are increasingly on the lookout for opportunities that may be undervalued in the current climate. In this context, identifying stocks estimated below their intrinsic value can offer potential avenues for growth, particularly as market dynamics fluctuate and investor sentiment remains cautious.
Top 10 Undervalued Stocks Based On Cash Flows
| Name | Current Price | Fair Value (Est) | Discount (Est) |
| NBTM New Materials Group (SHSE:600114) | CN¥15.65 | CN¥31.16 | 49.8% |
| Decisive Dividend (TSXV:DE) | CA$5.93 | CA$11.83 | 49.9% |
| S Foods (TSE:2292) | ¥2737.00 | ¥5472.35 | 50% |
| Emporiki Eisagogiki Aftokiniton Ditrohon kai Mihanon Thalassis Societe Anonyme (ATSE:MOTO) | €2.77 | €5.51 | 49.7% |
| Pluk Phak Praw Rak Mae (SET:OKJ) | THB15.50 | THB30.86 | 49.8% |
| Medley (TSE:4480) | ¥3835.00 | ¥7645.06 | 49.8% |
| Ally Financial (NYSE:ALLY) | US$36.01 | US$71.77 | 49.8% |
| Cicor Technologies (SWX:CICN) | CHF60.00 | CHF119.29 | 49.7% |
| Progress Software (NasdaqGS:PRGS) | US$65.15 | US$129.87 | 49.8% |
| SkyCity Entertainment Group (NZSE:SKC) | NZ$1.45 | NZ$2.89 | 49.8% |
Underneath we present a selection of stocks filtered out by our screen.
Harvia Oyj (HLSE:HARVIA)
Overview: Harvia Oyj manufactures and distributes traditional, steam, and infrared saunas with a market cap of €800.87 million.
Operations: The company's revenue is primarily derived from its Building Materials - HVAC Equipment segment, amounting to €163.66 million.
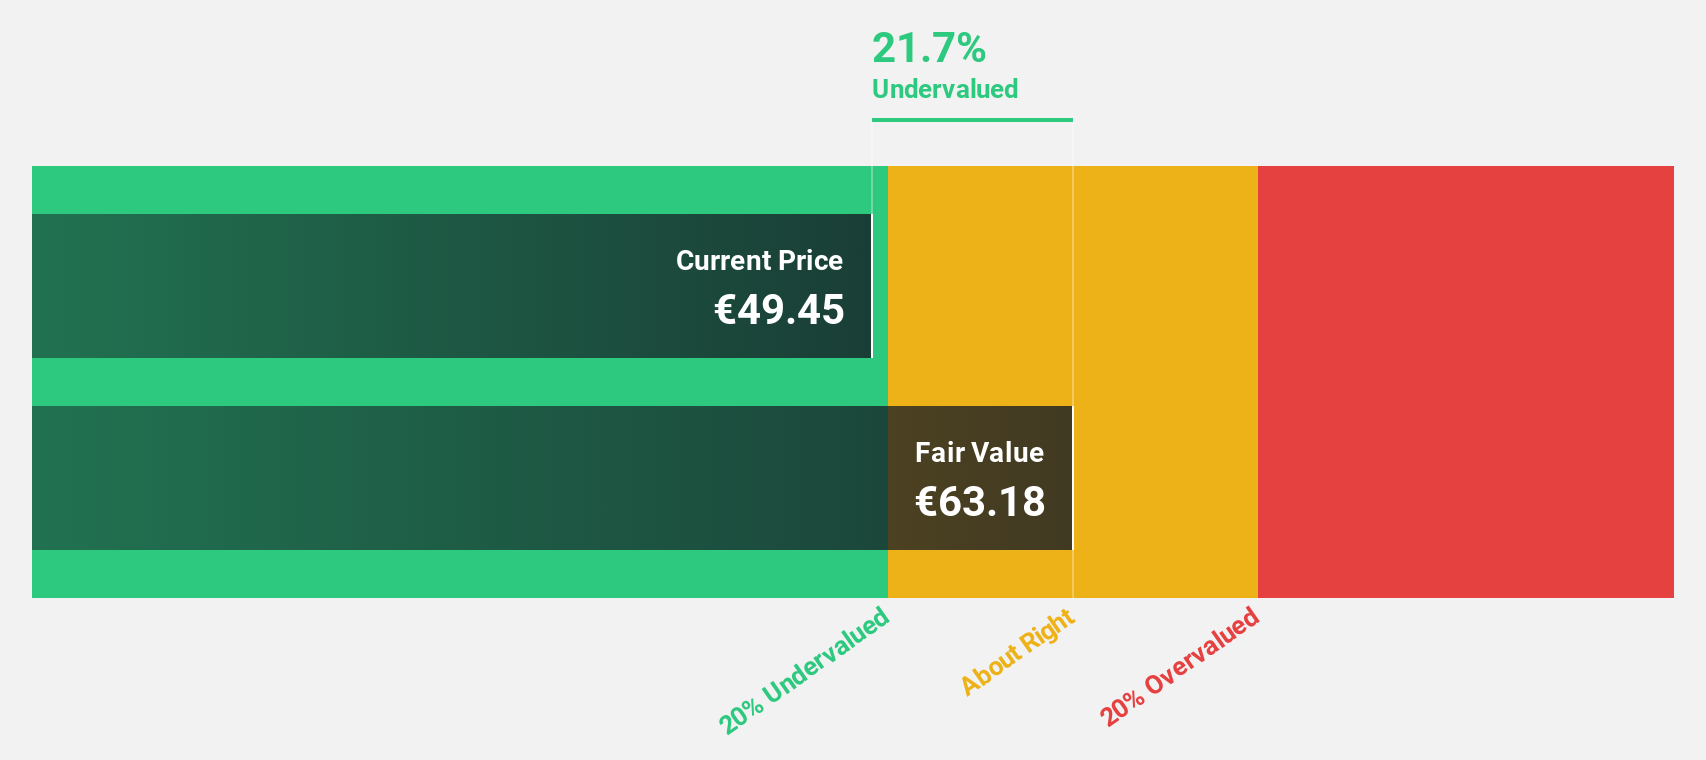
Estimated Discount To Fair Value: 17%
Harvia Oyj appears undervalued with its current trading price of €42.85, 17% below the estimated fair value of €51.62. Despite high debt levels, Harvia's earnings have grown by 29.5% over the past year and are forecasted to grow at 17.2% annually, outpacing the Finnish market's projected growth rate of 14.1%. Recent strategic moves include a share buyback program and appointing Ivan Sabato to drive growth in Continental Europe, potentially enhancing future cash flows.
- Insights from our recent growth report point to a promising forecast for Harvia Oyj's business outlook.
- Get an in-depth perspective on Harvia Oyj's balance sheet by reading our health report here.
Sweco (OM:SWEC B)
Overview: Sweco AB (publ) is a global provider of architecture and engineering consultancy services, with a market cap of SEK59.22 billion.
Operations: The company's revenue segments include Sweco Sweden at SEK8.88 billion, Sweco Belgium at SEK3.99 billion, Sweco Finland at SEK3.62 billion, Sweco Norway at SEK3.48 billion, Sweco Denmark at SEK3.38 billion, Sweco Netherlands at SEK3.28 billion, and Sweco Germany & Central Europe at SEK2.78 billion; with additional contributions from Sweco UK amounting to SEK1.48 billion.
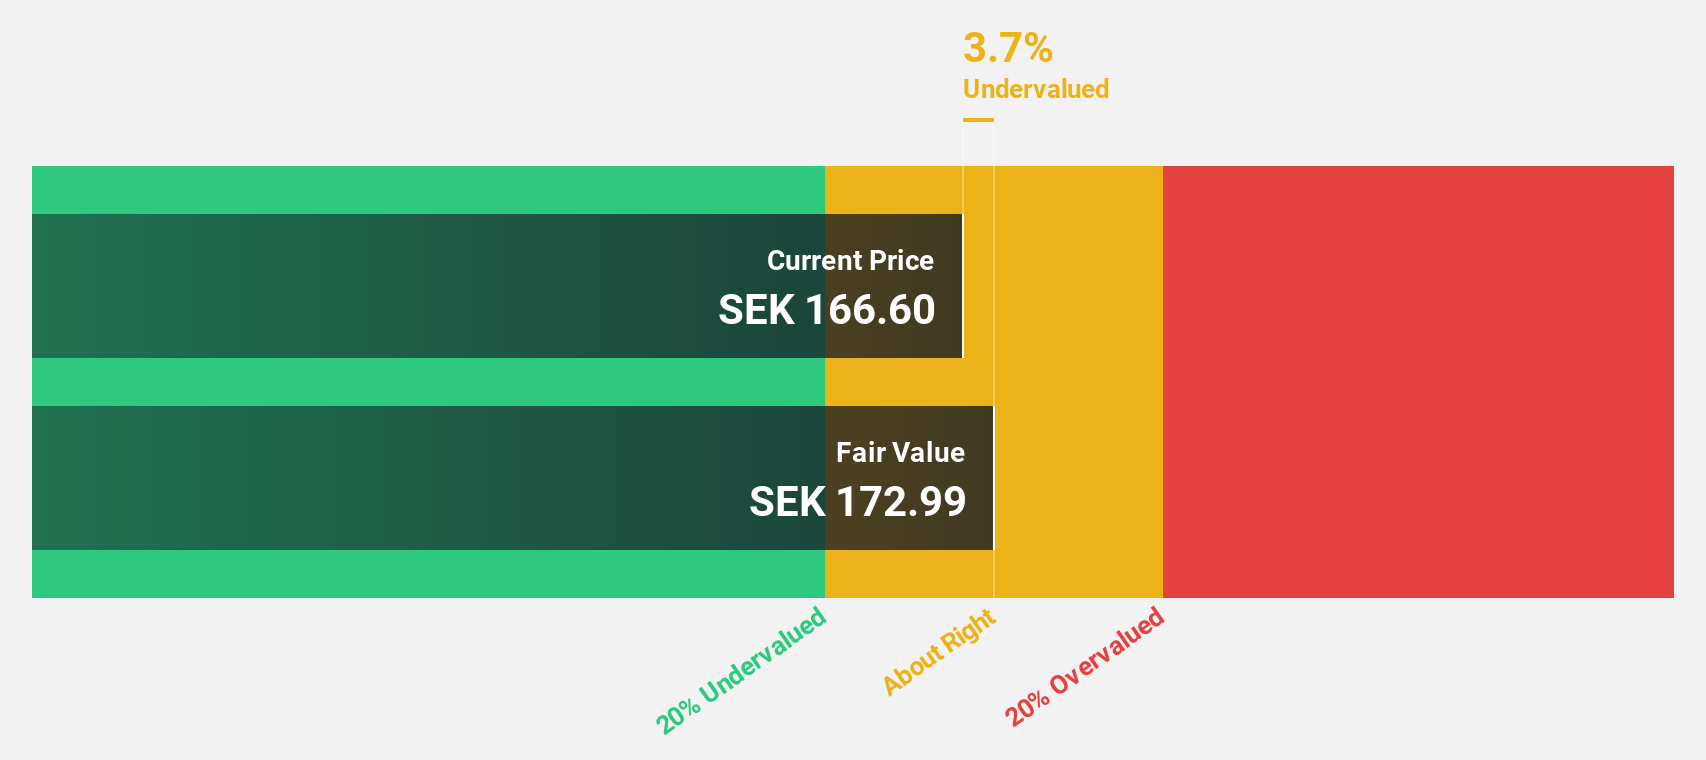
Estimated Discount To Fair Value: 34.8%
Sweco, trading at SEK164.7, is undervalued with a fair value estimate of SEK252.44. Its earnings have grown by 8% and are expected to increase 16.1% annually, surpassing the Swedish market's growth rate of 14.6%. Recent contracts in Germany and Helsinki highlight its expertise in infrastructure projects, potentially boosting future cash flows. However, an unstable dividend track record may concern some investors despite strong forecasted earnings growth and a high return on equity projection of 21.2%.
- The analysis detailed in our Sweco growth report hints at robust future financial performance.
- Click to explore a detailed breakdown of our findings in Sweco's balance sheet health report.
Binjiang Service Group (SEHK:3316)
Overview: Binjiang Service Group Co. Ltd. offers property management and related services in the People’s Republic of China, with a market cap of HK$5.57 billion.
Operations: Revenue Segments (in millions of CN¥): Binjiang Service Group Co. Ltd.'s revenue is primarily derived from property management and related services in China.
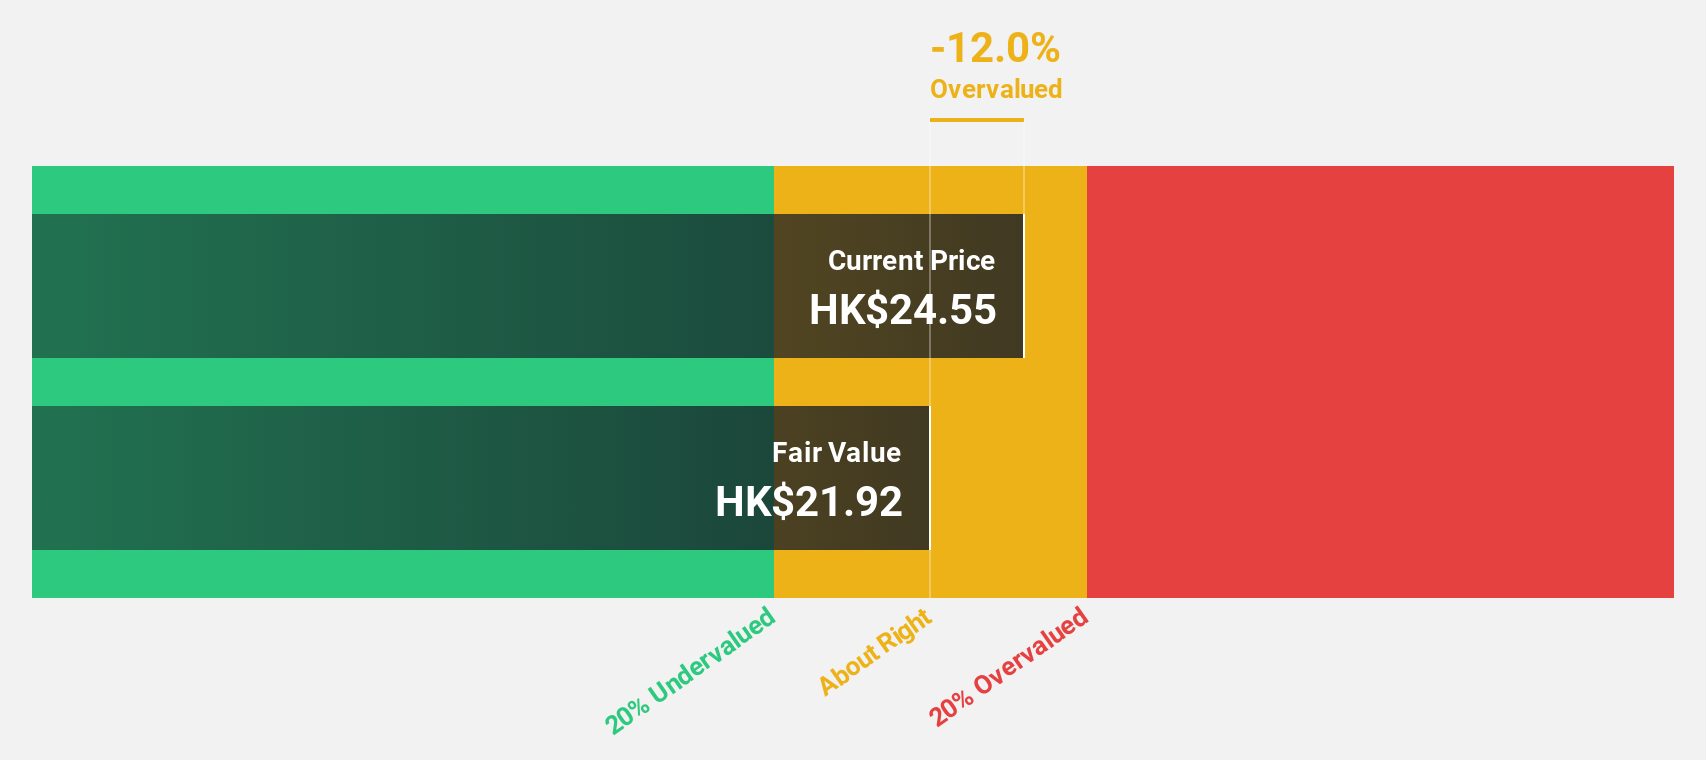
Estimated Discount To Fair Value: 23.3%
Binjiang Service Group, trading at HK$20.3, is undervalued with a fair value estimate of HK$26.48. Its earnings grew by 16.4% last year and are forecast to grow 15% annually, outpacing the Hong Kong market's growth rate of 11.1%. Despite an unstable dividend track record, a high return on equity projection of 35.6% supports its potential value based on cash flows. Recent agreements with Binjiang Real Estate may enhance future revenue streams through continued service provision.
- Our earnings growth report unveils the potential for significant increases in Binjiang Service Group's future results.
- Delve into the full analysis health report here for a deeper understanding of Binjiang Service Group.
Summing It All Up
- Navigate through the entire inventory of 883 Undervalued Stocks Based On Cash Flows here.
- Hold shares in these firms? Setup your portfolio in Simply Wall St to seamlessly track your investments and receive personalized updates on your portfolio's performance.
- Enhance your investing ability with the Simply Wall St app and enjoy free access to essential market intelligence spanning every continent.
Want To Explore Some Alternatives?
- Explore high-performing small cap companies that haven't yet garnered significant analyst attention.
- Diversify your portfolio with solid dividend payers offering reliable income streams to weather potential market turbulence.
- Fuel your portfolio with companies showing strong growth potential, backed by optimistic outlooks both from analysts and management.
This article by Simply Wall St is general in nature. We provide commentary based on historical data and analyst forecasts only using an unbiased methodology and our articles are not intended to be financial advice. It does not constitute a recommendation to buy or sell any stock, and does not take account of your objectives, or your financial situation. We aim to bring you long-term focused analysis driven by fundamental data. Note that our analysis may not factor in the latest price-sensitive company announcements or qualitative material. Simply Wall St has no position in any stocks mentioned.
Have feedback on this article? Concerned about the content? Get in touch with us directly. Alternatively, email editorial-team@simplywallst.com