
Despite an already strong run, Lisi Group (Holdings) Limited (HKG:526) shares have been powering on, with a gain of 31% in the last thirty days. The last 30 days were the cherry on top of the stock's 430% gain in the last year, which is nothing short of spectacular.
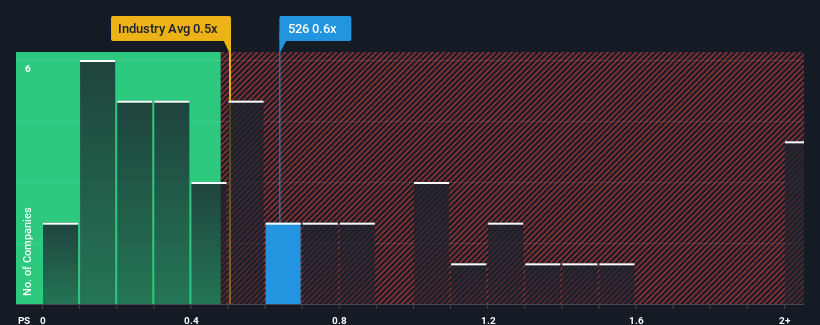
In spite of the firm bounce in price, it's still not a stretch to say that Lisi Group (Holdings)'s price-to-sales (or "P/S") ratio of 0.6x right now seems quite "middle-of-the-road" compared to the Consumer Durables industry in Hong Kong, where the median P/S ratio is around 0.5x. While this might not raise any eyebrows, if the P/S ratio is not justified investors could be missing out on a potential opportunity or ignoring looming disappointment.
Check out our latest analysis for Lisi Group (Holdings)
What Does Lisi Group (Holdings)'s P/S Mean For Shareholders?
Lisi Group (Holdings) has been doing a good job lately as it's been growing revenue at a solid pace. It might be that many expect the respectable revenue performance to wane, which has kept the P/S from rising. Those who are bullish on Lisi Group (Holdings) will be hoping that this isn't the case, so that they can pick up the stock at a lower valuation.
Although there are no analyst estimates available for Lisi Group (Holdings), take a look at this free data-rich visualisation to see how the company stacks up on earnings, revenue and cash flow.What Are Revenue Growth Metrics Telling Us About The P/S?
There's an inherent assumption that a company should be matching the industry for P/S ratios like Lisi Group (Holdings)'s to be considered reasonable.
Retrospectively, the last year delivered a decent 11% gain to the company's revenues. The latest three year period has also seen an excellent 37% overall rise in revenue, aided somewhat by its short-term performance. Accordingly, shareholders would have definitely welcomed those medium-term rates of revenue growth.
Comparing that to the industry, which is predicted to deliver 12% growth in the next 12 months, the company's momentum is pretty similar based on recent medium-term annualised revenue results.
With this information, we can see why Lisi Group (Holdings) is trading at a fairly similar P/S to the industry. It seems most investors are expecting to see average growth rates continue into the future and are only willing to pay a moderate amount for the stock.
The Key Takeaway
Lisi Group (Holdings) appears to be back in favour with a solid price jump bringing its P/S back in line with other companies in the industry Using the price-to-sales ratio alone to determine if you should sell your stock isn't sensible, however it can be a practical guide to the company's future prospects.
As we've seen, Lisi Group (Holdings)'s three-year revenue trends seem to be contributing to its P/S, given they look similar to current industry expectations. With previous revenue trends that keep up with the current industry outlook, it's hard to justify the company's P/S ratio deviating much from it's current point. Given the current circumstances, it seems improbable that the share price will experience any significant movement in either direction in the near future if recent medium-term revenue trends persist.
Don't forget that there may be other risks. For instance, we've identified 4 warning signs for Lisi Group (Holdings) (1 doesn't sit too well with us) you should be aware of.
If companies with solid past earnings growth is up your alley, you may wish to see this free collection of other companies with strong earnings growth and low P/E ratios.
Have feedback on this article? Concerned about the content? Get in touch with us directly. Alternatively, email editorial-team (at) simplywallst.com.
This article by Simply Wall St is general in nature. We provide commentary based on historical data and analyst forecasts only using an unbiased methodology and our articles are not intended to be financial advice. It does not constitute a recommendation to buy or sell any stock, and does not take account of your objectives, or your financial situation. We aim to bring you long-term focused analysis driven by fundamental data. Note that our analysis may not factor in the latest price-sensitive company announcements or qualitative material. Simply Wall St has no position in any stocks mentioned.