
While it may not be enough for some shareholders, we think it is good to see the China Overseas Land & Investment Limited (HKG:688) share price up 17% in a single quarter. But that doesn't change the fact that the returns over the last five years have been less than pleasing. You would have done a lot better buying an index fund, since the stock has dropped 53% in that half decade.
Although the past week has been more reassuring for shareholders, they're still in the red over the last five years, so let's see if the underlying business has been responsible for the decline.
Check out our latest analysis for China Overseas Land & Investment
To paraphrase Benjamin Graham: Over the short term the market is a voting machine, but over the long term it's a weighing machine. One flawed but reasonable way to assess how sentiment around a company has changed is to compare the earnings per share (EPS) with the share price.
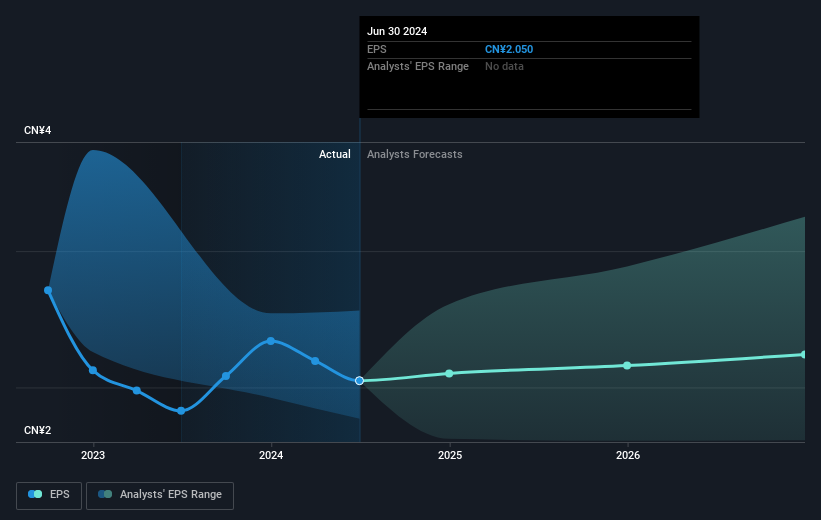
During the five years over which the share price declined, China Overseas Land & Investment's earnings per share (EPS) dropped by 10% each year. Readers should note that the share price has fallen faster than the EPS, at a rate of 14% per year, over the period. This implies that the market is more cautious about the business these days. The low P/E ratio of 6.29 further reflects this reticence.
The company's earnings per share (over time) is depicted in the image below (click to see the exact numbers).
We know that China Overseas Land & Investment has improved its bottom line lately, but is it going to grow revenue? You could check out this free report showing analyst revenue forecasts.
What About Dividends?
When looking at investment returns, it is important to consider the difference between total shareholder return (TSR) and share price return. Whereas the share price return only reflects the change in the share price, the TSR includes the value of dividends (assuming they were reinvested) and the benefit of any discounted capital raising or spin-off. It's fair to say that the TSR gives a more complete picture for stocks that pay a dividend. We note that for China Overseas Land & Investment the TSR over the last 5 years was -38%, which is better than the share price return mentioned above. This is largely a result of its dividend payments!
A Different Perspective
China Overseas Land & Investment provided a TSR of 13% over the last twelve months. But that return falls short of the market. But at least that's still a gain! Over five years the TSR has been a reduction of 7% per year, over five years. So this might be a sign the business has turned its fortunes around. While it is well worth considering the different impacts that market conditions can have on the share price, there are other factors that are even more important. Even so, be aware that China Overseas Land & Investment is showing 1 warning sign in our investment analysis , you should know about...
If you would prefer to check out another company -- one with potentially superior financials -- then do not miss this free list of companies that have proven they can grow earnings.
Please note, the market returns quoted in this article reflect the market weighted average returns of stocks that currently trade on Hong Kong exchanges.
Have feedback on this article? Concerned about the content? Get in touch with us directly. Alternatively, email editorial-team (at) simplywallst.com.
This article by Simply Wall St is general in nature. We provide commentary based on historical data and analyst forecasts only using an unbiased methodology and our articles are not intended to be financial advice. It does not constitute a recommendation to buy or sell any stock, and does not take account of your objectives, or your financial situation. We aim to bring you long-term focused analysis driven by fundamental data. Note that our analysis may not factor in the latest price-sensitive company announcements or qualitative material. Simply Wall St has no position in any stocks mentioned.