
It's nice to see the Sa Sa International Holdings Limited (HKG:178) share price up 15% in a week. But over the last three years we've seen a quite serious decline. Tragically, the share price declined 56% in that time. So it is really good to see an improvement. Perhaps the company has turned over a new leaf.
While the last three years has been tough for Sa Sa International Holdings shareholders, this past week has shown signs of promise. So let's look at the longer term fundamentals and see if they've been the driver of the negative returns.
View our latest analysis for Sa Sa International Holdings
To quote Buffett, 'Ships will sail around the world but the Flat Earth Society will flourish. There will continue to be wide discrepancies between price and value in the marketplace...' By comparing earnings per share (EPS) and share price changes over time, we can get a feel for how investor attitudes to a company have morphed over time.
During five years of share price growth, Sa Sa International Holdings moved from a loss to profitability. We would usually expect to see the share price rise as a result. So it's worth looking at other metrics to try to understand the share price move.
We note that, in three years, revenue has actually grown at a 10% annual rate, so that doesn't seem to be a reason to sell shares. It's probably worth investigating Sa Sa International Holdings further; while we may be missing something on this analysis, there might also be an opportunity.
The company's revenue and earnings (over time) are depicted in the image below (click to see the exact numbers).
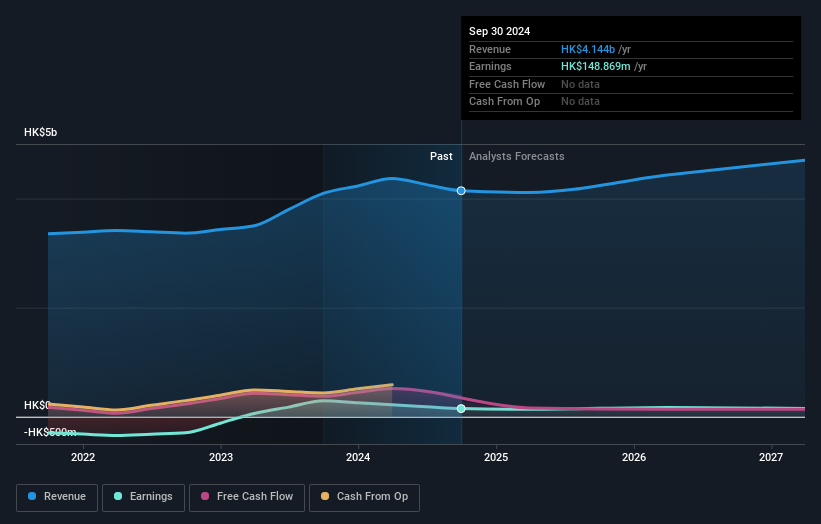
It is of course excellent to see how Sa Sa International Holdings has grown profits over the years, but the future is more important for shareholders. If you are thinking of buying or selling Sa Sa International Holdings stock, you should check out this FREE detailed report on its balance sheet.
What About Dividends?
It is important to consider the total shareholder return, as well as the share price return, for any given stock. The TSR incorporates the value of any spin-offs or discounted capital raisings, along with any dividends, based on the assumption that the dividends are reinvested. It's fair to say that the TSR gives a more complete picture for stocks that pay a dividend. We note that for Sa Sa International Holdings the TSR over the last 3 years was -53%, which is better than the share price return mentioned above. And there's no prize for guessing that the dividend payments largely explain the divergence!
A Different Perspective
While the broader market gained around 18% in the last year, Sa Sa International Holdings shareholders lost 25% (even including dividends). However, keep in mind that even the best stocks will sometimes underperform the market over a twelve month period. Unfortunately, last year's performance may indicate unresolved challenges, given that it was worse than the annualised loss of 9% over the last half decade. We realise that Baron Rothschild has said investors should "buy when there is blood on the streets", but we caution that investors should first be sure they are buying a high quality business. It's always interesting to track share price performance over the longer term. But to understand Sa Sa International Holdings better, we need to consider many other factors. Take risks, for example - Sa Sa International Holdings has 1 warning sign we think you should be aware of.
But note: Sa Sa International Holdings may not be the best stock to buy. So take a peek at this free list of interesting companies with past earnings growth (and further growth forecast).
Please note, the market returns quoted in this article reflect the market weighted average returns of stocks that currently trade on Hong Kong exchanges.
Have feedback on this article? Concerned about the content? Get in touch with us directly. Alternatively, email editorial-team (at) simplywallst.com.
This article by Simply Wall St is general in nature. We provide commentary based on historical data and analyst forecasts only using an unbiased methodology and our articles are not intended to be financial advice. It does not constitute a recommendation to buy or sell any stock, and does not take account of your objectives, or your financial situation. We aim to bring you long-term focused analysis driven by fundamental data. Note that our analysis may not factor in the latest price-sensitive company announcements or qualitative material. Simply Wall St has no position in any stocks mentioned.