
Graphex Group Limited (HKG:6128) shareholders that were waiting for something to happen have been dealt a blow with a 52% share price drop in the last month. The recent drop completes a disastrous twelve months for shareholders, who are sitting on a 90% loss during that time.
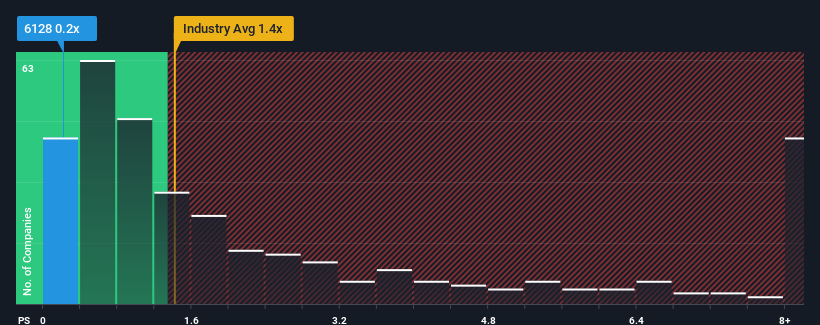
Although its price has dipped substantially, it's still not a stretch to say that Graphex Group's price-to-sales (or "P/S") ratio of 0.2x right now seems quite "middle-of-the-road" compared to the Professional Services industry in Hong Kong, where the median P/S ratio is around 0.4x. Although, it's not wise to simply ignore the P/S without explanation as investors may be disregarding a distinct opportunity or a costly mistake.
Check out our latest analysis for Graphex Group
What Does Graphex Group's Recent Performance Look Like?
Graphex Group could be doing better as its revenue has been going backwards lately while most other companies have been seeing positive revenue growth. One possibility is that the P/S ratio is moderate because investors think this poor revenue performance will turn around. You'd really hope so, otherwise you're paying a relatively elevated price for a company with this sort of growth profile.
Keen to find out how analysts think Graphex Group's future stacks up against the industry? In that case, our free report is a great place to start.Do Revenue Forecasts Match The P/S Ratio?
There's an inherent assumption that a company should be matching the industry for P/S ratios like Graphex Group's to be considered reasonable.
In reviewing the last year of financials, we were disheartened to see the company's revenues fell to the tune of 29%. The last three years don't look nice either as the company has shrunk revenue by 44% in aggregate. Accordingly, shareholders would have felt downbeat about the medium-term rates of revenue growth.
Turning to the outlook, the next year should bring diminished returns, with revenue decreasing 20% as estimated by the sole analyst watching the company. Meanwhile, the broader industry is forecast to expand by 10%, which paints a poor picture.
With this information, we find it concerning that Graphex Group is trading at a fairly similar P/S compared to the industry. It seems most investors are hoping for a turnaround in the company's business prospects, but the analyst cohort is not so confident this will happen. Only the boldest would assume these prices are sustainable as these declining revenues are likely to weigh on the share price eventually.
What Does Graphex Group's P/S Mean For Investors?
With its share price dropping off a cliff, the P/S for Graphex Group looks to be in line with the rest of the Professional Services industry. Generally, our preference is to limit the use of the price-to-sales ratio to establishing what the market thinks about the overall health of a company.
While Graphex Group's P/S isn't anything out of the ordinary for companies in the industry, we didn't expect it given forecasts of revenue decline. When we see a gloomy outlook like this, our immediate thoughts are that the share price is at risk of declining, negatively impacting P/S. If we consider the revenue outlook, the P/S seems to indicate that potential investors may be paying a premium for the stock.
Before you take the next step, you should know about the 4 warning signs for Graphex Group (2 are a bit concerning!) that we have uncovered.
If you're unsure about the strength of Graphex Group's business, why not explore our interactive list of stocks with solid business fundamentals for some other companies you may have missed.
Have feedback on this article? Concerned about the content? Get in touch with us directly. Alternatively, email editorial-team (at) simplywallst.com.
This article by Simply Wall St is general in nature. We provide commentary based on historical data and analyst forecasts only using an unbiased methodology and our articles are not intended to be financial advice. It does not constitute a recommendation to buy or sell any stock, and does not take account of your objectives, or your financial situation. We aim to bring you long-term focused analysis driven by fundamental data. Note that our analysis may not factor in the latest price-sensitive company announcements or qualitative material. Simply Wall St has no position in any stocks mentioned.