
Despite an already strong run, Alphamab Oncology (HKG:9966) shares have been powering on, with a gain of 31% in the last thirty days. Unfortunately, the gains of the last month did little to right the losses of the last year with the stock still down 27% over that time.
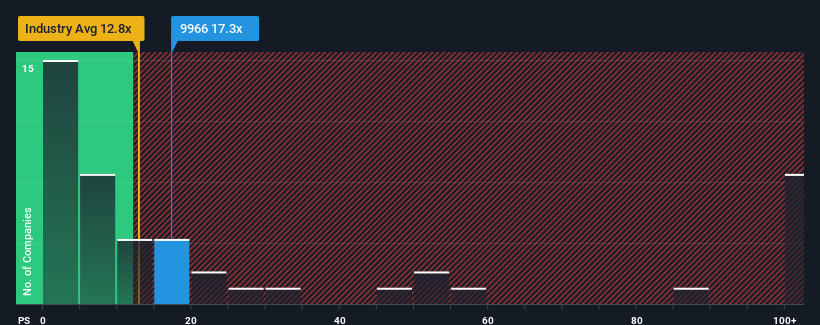
Since its price has surged higher, Alphamab Oncology's price-to-sales (or "P/S") ratio of 17.3x might make it look like a sell right now compared to the wider Biotechs industry in Hong Kong, where around half of the companies have P/S ratios below 12.8x and even P/S below 2x are quite common. Nonetheless, we'd need to dig a little deeper to determine if there is a rational basis for the elevated P/S.
Check out our latest analysis for Alphamab Oncology
How Alphamab Oncology Has Been Performing
Recent times haven't been great for Alphamab Oncology as its revenue has been rising slower than most other companies. One possibility is that the P/S ratio is high because investors think this lacklustre revenue performance will improve markedly. You'd really hope so, otherwise you're paying a pretty hefty price for no particular reason.
Want the full picture on analyst estimates for the company? Then our free report on Alphamab Oncology will help you uncover what's on the horizon.How Is Alphamab Oncology's Revenue Growth Trending?
Alphamab Oncology's P/S ratio would be typical for a company that's expected to deliver solid growth, and importantly, perform better than the industry.
If we review the last year of revenue, the company posted a result that saw barely any deviation from a year ago. The longer-term trend has been no better as the company has no revenue growth to show for over the last three years either. Therefore, it's fair to say that revenue growth has definitely eluded the company recently.
Looking ahead now, revenue is anticipated to climb by 67% per year during the coming three years according to the three analysts following the company. With the industry only predicted to deliver 54% per year, the company is positioned for a stronger revenue result.
In light of this, it's understandable that Alphamab Oncology's P/S sits above the majority of other companies. It seems most investors are expecting this strong future growth and are willing to pay more for the stock.
The Bottom Line On Alphamab Oncology's P/S
Alphamab Oncology shares have taken a big step in a northerly direction, but its P/S is elevated as a result. Generally, our preference is to limit the use of the price-to-sales ratio to establishing what the market thinks about the overall health of a company.
As we suspected, our examination of Alphamab Oncology's analyst forecasts revealed that its superior revenue outlook is contributing to its high P/S. At this stage investors feel the potential for a deterioration in revenues is quite remote, justifying the elevated P/S ratio. Unless the analysts have really missed the mark, these strong revenue forecasts should keep the share price buoyant.
It's always necessary to consider the ever-present spectre of investment risk. We've identified 1 warning sign with Alphamab Oncology, and understanding should be part of your investment process.
Of course, profitable companies with a history of great earnings growth are generally safer bets. So you may wish to see this free collection of other companies that have reasonable P/E ratios and have grown earnings strongly.
Have feedback on this article? Concerned about the content? Get in touch with us directly. Alternatively, email editorial-team (at) simplywallst.com.
This article by Simply Wall St is general in nature. We provide commentary based on historical data and analyst forecasts only using an unbiased methodology and our articles are not intended to be financial advice. It does not constitute a recommendation to buy or sell any stock, and does not take account of your objectives, or your financial situation. We aim to bring you long-term focused analysis driven by fundamental data. Note that our analysis may not factor in the latest price-sensitive company announcements or qualitative material. Simply Wall St has no position in any stocks mentioned.