
If we're looking to avoid a business that is in decline, what are the trends that can warn us ahead of time? More often than not, we'll see a declining return on capital employed (ROCE) and a declining amount of capital employed. Trends like this ultimately mean the business is reducing its investments and also earning less on what it has invested. So after we looked into Sun Art Retail Group (HKG:6808), the trends above didn't look too great.
What Is Return On Capital Employed (ROCE)?
For those who don't know, ROCE is a measure of a company's yearly pre-tax profit (its return), relative to the capital employed in the business. Analysts use this formula to calculate it for Sun Art Retail Group:
Return on Capital Employed = Earnings Before Interest and Tax (EBIT) ÷ (Total Assets - Current Liabilities)
0.0063 = CN¥172m ÷ (CN¥62b - CN¥35b) (Based on the trailing twelve months to September 2024).
Thus, Sun Art Retail Group has an ROCE of 0.6%. In absolute terms, that's a low return and it also under-performs the Consumer Retailing industry average of 7.3%.
View our latest analysis for Sun Art Retail Group
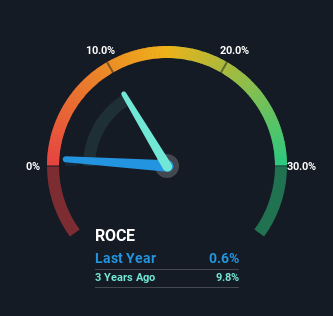
In the above chart we have measured Sun Art Retail Group's prior ROCE against its prior performance, but the future is arguably more important. If you'd like, you can check out the forecasts from the analysts covering Sun Art Retail Group for free.
So How Is Sun Art Retail Group's ROCE Trending?
We are a bit worried about the trend of returns on capital at Sun Art Retail Group. To be more specific, the ROCE was 14% five years ago, but since then it has dropped noticeably. And on the capital employed front, the business is utilizing roughly the same amount of capital as it was back then. This combination can be indicative of a mature business that still has areas to deploy capital, but the returns received aren't as high due potentially to new competition or smaller margins. So because these trends aren't typically conducive to creating a multi-bagger, we wouldn't hold our breath on Sun Art Retail Group becoming one if things continue as they have.
On a side note, Sun Art Retail Group's current liabilities are still rather high at 56% of total assets. This effectively means that suppliers (or short-term creditors) are funding a large portion of the business, so just be aware that this can introduce some elements of risk. Ideally we'd like to see this reduce as that would mean fewer obligations bearing risks.
The Key Takeaway
All in all, the lower returns from the same amount of capital employed aren't exactly signs of a compounding machine. This could explain why the stock has sunk a total of 74% in the last five years. That being the case, unless the underlying trends revert to a more positive trajectory, we'd consider looking elsewhere.
If you're still interested in Sun Art Retail Group it's worth checking out our FREE intrinsic value approximation for 6808 to see if it's trading at an attractive price in other respects.
While Sun Art Retail Group isn't earning the highest return, check out this free list of companies that are earning high returns on equity with solid balance sheets.
Have feedback on this article? Concerned about the content? Get in touch with us directly. Alternatively, email editorial-team (at) simplywallst.com.
This article by Simply Wall St is general in nature. We provide commentary based on historical data and analyst forecasts only using an unbiased methodology and our articles are not intended to be financial advice. It does not constitute a recommendation to buy or sell any stock, and does not take account of your objectives, or your financial situation. We aim to bring you long-term focused analysis driven by fundamental data. Note that our analysis may not factor in the latest price-sensitive company announcements or qualitative material. Simply Wall St has no position in any stocks mentioned.