
XD's (HKG:2400) stock up by 4.6% over the past week. However, the company's financials look a bit inconsistent and market outcomes are ultimately driven by long-term fundamentals, meaning that the stock could head in either direction. Specifically, we decided to study XD's ROE in this article.
Return on Equity or ROE is a test of how effectively a company is growing its value and managing investors’ money. In other words, it is a profitability ratio which measures the rate of return on the capital provided by the company's shareholders.
View our latest analysis for XD
How To Calculate Return On Equity?
The formula for ROE is:
Return on Equity = Net Profit (from continuing operations) ÷ Shareholders' Equity
So, based on the above formula, the ROE for XD is:
4.3% = CN¥82m ÷ CN¥1.9b (Based on the trailing twelve months to June 2024).
The 'return' is the profit over the last twelve months. That means that for every HK$1 worth of shareholders' equity, the company generated HK$0.04 in profit.
What Is The Relationship Between ROE And Earnings Growth?
Thus far, we have learned that ROE measures how efficiently a company is generating its profits. Depending on how much of these profits the company reinvests or "retains", and how effectively it does so, we are then able to assess a company’s earnings growth potential. Assuming everything else remains unchanged, the higher the ROE and profit retention, the higher the growth rate of a company compared to companies that don't necessarily bear these characteristics.
A Side By Side comparison of XD's Earnings Growth And 4.3% ROE
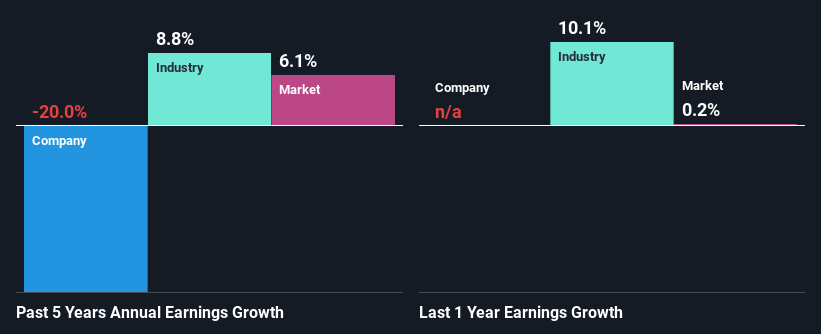
It is hard to argue that XD's ROE is much good in and of itself. Even compared to the average industry ROE of 6.7%, the company's ROE is quite dismal. Given the circumstances, the significant decline in net income by 20% seen by XD over the last five years is not surprising. We believe that there also might be other aspects that are negatively influencing the company's earnings prospects. For example, the business has allocated capital poorly, or that the company has a very high payout ratio.
However, when we compared XD's growth with the industry we found that while the company's earnings have been shrinking, the industry has seen an earnings growth of 8.8% in the same period. This is quite worrisome.
The basis for attaching value to a company is, to a great extent, tied to its earnings growth. The investor should try to establish if the expected growth or decline in earnings, whichever the case may be, is priced in. This then helps them determine if the stock is placed for a bright or bleak future. If you're wondering about XD's's valuation, check out this gauge of its price-to-earnings ratio, as compared to its industry.
Is XD Efficiently Re-investing Its Profits?
XD doesn't pay any regular dividends, meaning that the company is keeping all of its profits, which makes us wonder why it is retaining its earnings if it can't use them to grow its business. So there might be other factors at play here which could potentially be hampering growth. For example, the business has faced some headwinds.
Summary
On the whole, we feel that the performance shown by XD can be open to many interpretations. Even though it appears to be retaining most of its profits, given the low ROE, investors may not be benefitting from all that reinvestment after all. The low earnings growth suggests our theory correct. Having said that, looking at current analyst estimates, we found that the company's earnings growth rate is expected to see a huge improvement. To know more about the company's future earnings growth forecasts take a look at this free report on analyst forecasts for the company to find out more.
Have feedback on this article? Concerned about the content? Get in touch with us directly. Alternatively, email editorial-team (at) simplywallst.com.
This article by Simply Wall St is general in nature. We provide commentary based on historical data and analyst forecasts only using an unbiased methodology and our articles are not intended to be financial advice. It does not constitute a recommendation to buy or sell any stock, and does not take account of your objectives, or your financial situation. We aim to bring you long-term focused analysis driven by fundamental data. Note that our analysis may not factor in the latest price-sensitive company announcements or qualitative material. Simply Wall St has no position in any stocks mentioned.