
Yihai International Holding Ltd. (HKG:1579) shareholders should be happy to see the share price up 25% in the last quarter. But spare a thought for the long term holders, who have held the stock as it bled value over the last five years. Like a ship taking on water, the share price has sunk 74% in that time. While the recent increase might be a green shoot, we're certainly hesitant to rejoice. The important question is if the business itself justifies a higher share price in the long term.
With the stock having lost 3.4% in the past week, it's worth taking a look at business performance and seeing if there's any red flags.
View our latest analysis for Yihai International Holding
In his essay The Superinvestors of Graham-and-Doddsville Warren Buffett described how share prices do not always rationally reflect the value of a business. One imperfect but simple way to consider how the market perception of a company has shifted is to compare the change in the earnings per share (EPS) with the share price movement.
During the unfortunate half decade during which the share price slipped, Yihai International Holding actually saw its earnings per share (EPS) improve by 5.9% per year. Given the share price reaction, one might suspect that EPS is not a good guide to the business performance during the period (perhaps due to a one-off loss or gain). Or possibly, the market was previously very optimistic, so the stock has disappointed, despite improving EPS.
Due to the lack of correlation between the EPS growth and the falling share price, it's worth taking a look at other metrics to try to understand the share price movement.
We note that the dividend has remained healthy, so that wouldn't really explain the share price drop. While it's not completely obvious why the share price is down, a closer look at the company's history might help explain it.
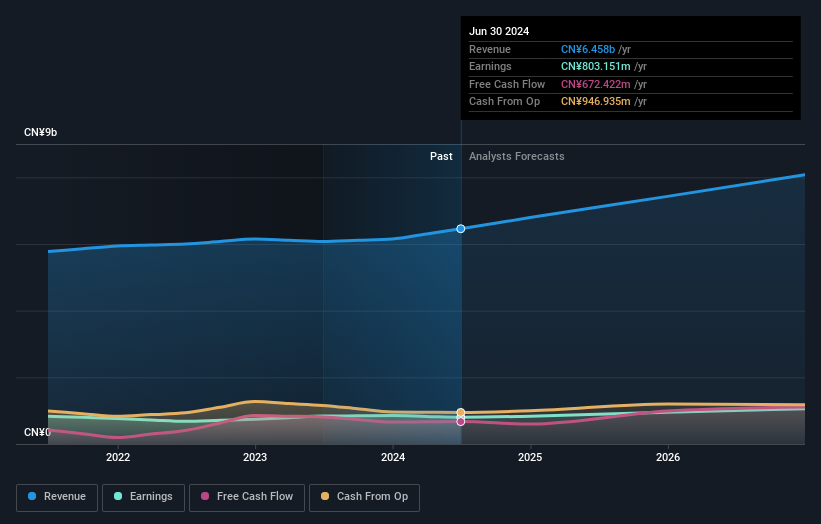
The image below shows how earnings and revenue have tracked over time (if you click on the image you can see greater detail).
We like that insiders have been buying shares in the last twelve months. Having said that, most people consider earnings and revenue growth trends to be a more meaningful guide to the business. This free report showing analyst forecasts should help you form a view on Yihai International Holding
What About Dividends?
As well as measuring the share price return, investors should also consider the total shareholder return (TSR). The TSR incorporates the value of any spin-offs or discounted capital raisings, along with any dividends, based on the assumption that the dividends are reinvested. Arguably, the TSR gives a more comprehensive picture of the return generated by a stock. As it happens, Yihai International Holding's TSR for the last 5 years was -71%, which exceeds the share price return mentioned earlier. This is largely a result of its dividend payments!
A Different Perspective
Yihai International Holding provided a TSR of 5.1% over the last twelve months. But that was short of the market average. But at least that's still a gain! Over five years the TSR has been a reduction of 11% per year, over five years. So this might be a sign the business has turned its fortunes around. It's always interesting to track share price performance over the longer term. But to understand Yihai International Holding better, we need to consider many other factors. Consider risks, for instance. Every company has them, and we've spotted 1 warning sign for Yihai International Holding you should know about.
Yihai International Holding is not the only stock that insiders are buying. For those who like to find lesser know companies this free list of growing companies with recent insider purchasing, could be just the ticket.
Please note, the market returns quoted in this article reflect the market weighted average returns of stocks that currently trade on Hong Kong exchanges.
Have feedback on this article? Concerned about the content? Get in touch with us directly. Alternatively, email editorial-team (at) simplywallst.com.
This article by Simply Wall St is general in nature. We provide commentary based on historical data and analyst forecasts only using an unbiased methodology and our articles are not intended to be financial advice. It does not constitute a recommendation to buy or sell any stock, and does not take account of your objectives, or your financial situation. We aim to bring you long-term focused analysis driven by fundamental data. Note that our analysis may not factor in the latest price-sensitive company announcements or qualitative material. Simply Wall St has no position in any stocks mentioned.