
Sandmartin International Holdings Limited (HKG:482) shares have had a horrible month, losing 26% after a relatively good period beforehand. Longer-term, the stock has been solid despite a difficult 30 days, gaining 20% in the last year.
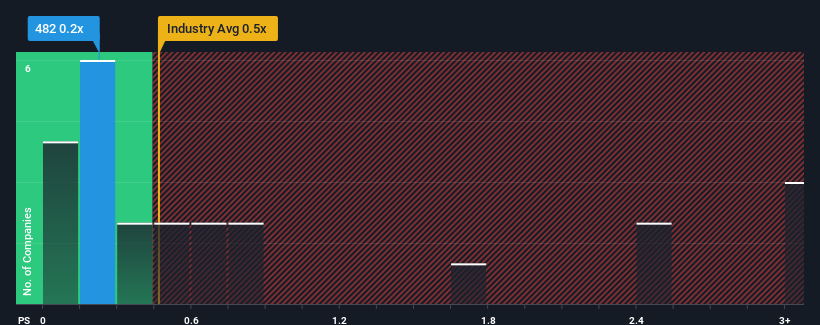
In spite of the heavy fall in price, it's still not a stretch to say that Sandmartin International Holdings' price-to-sales (or "P/S") ratio of 0.2x right now seems quite "middle-of-the-road" compared to the Communications industry in Hong Kong, where the median P/S ratio is around 0.5x. Although, it's not wise to simply ignore the P/S without explanation as investors may be disregarding a distinct opportunity or a costly mistake.
Check out our latest analysis for Sandmartin International Holdings
What Does Sandmartin International Holdings' P/S Mean For Shareholders?
For example, consider that Sandmartin International Holdings' financial performance has been poor lately as its revenue has been in decline. One possibility is that the P/S is moderate because investors think the company might still do enough to be in line with the broader industry in the near future. If you like the company, you'd at least be hoping this is the case so that you could potentially pick up some stock while it's not quite in favour.
Want the full picture on earnings, revenue and cash flow for the company? Then our free report on Sandmartin International Holdings will help you shine a light on its historical performance.How Is Sandmartin International Holdings' Revenue Growth Trending?
There's an inherent assumption that a company should be matching the industry for P/S ratios like Sandmartin International Holdings' to be considered reasonable.
In reviewing the last year of financials, we were disheartened to see the company's revenues fell to the tune of 3.8%. This means it has also seen a slide in revenue over the longer-term as revenue is down 39% in total over the last three years. So unfortunately, we have to acknowledge that the company has not done a great job of growing revenue over that time.
Weighing that medium-term revenue trajectory against the broader industry's one-year forecast for expansion of 35% shows it's an unpleasant look.
With this information, we find it concerning that Sandmartin International Holdings is trading at a fairly similar P/S compared to the industry. Apparently many investors in the company are way less bearish than recent times would indicate and aren't willing to let go of their stock right now. There's a good chance existing shareholders are setting themselves up for future disappointment if the P/S falls to levels more in line with the recent negative growth rates.
The Key Takeaway
Following Sandmartin International Holdings' share price tumble, its P/S is just clinging on to the industry median P/S. It's argued the price-to-sales ratio is an inferior measure of value within certain industries, but it can be a powerful business sentiment indicator.
The fact that Sandmartin International Holdings currently trades at a P/S on par with the rest of the industry is surprising to us since its recent revenues have been in decline over the medium-term, all while the industry is set to grow. When we see revenue heading backwards in the context of growing industry forecasts, it'd make sense to expect a possible share price decline on the horizon, sending the moderate P/S lower. If recent medium-term revenue trends continue, it will place shareholders' investments at risk and potential investors in danger of paying an unnecessary premium.
And what about other risks? Every company has them, and we've spotted 3 warning signs for Sandmartin International Holdings (of which 2 are a bit concerning!) you should know about.
Of course, profitable companies with a history of great earnings growth are generally safer bets. So you may wish to see this free collection of other companies that have reasonable P/E ratios and have grown earnings strongly.
Have feedback on this article? Concerned about the content? Get in touch with us directly. Alternatively, email editorial-team (at) simplywallst.com.
This article by Simply Wall St is general in nature. We provide commentary based on historical data and analyst forecasts only using an unbiased methodology and our articles are not intended to be financial advice. It does not constitute a recommendation to buy or sell any stock, and does not take account of your objectives, or your financial situation. We aim to bring you long-term focused analysis driven by fundamental data. Note that our analysis may not factor in the latest price-sensitive company announcements or qualitative material. Simply Wall St has no position in any stocks mentioned.