
C Cheng Holdings Limited (HKG:1486) shares have had a really impressive month, gaining 38% after a shaky period beforehand. Not all shareholders will be feeling jubilant, since the share price is still down a very disappointing 19% in the last twelve months.
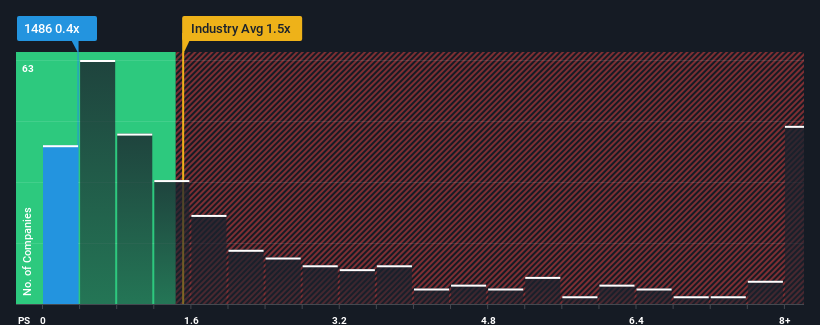
Even after such a large jump in price, you could still be forgiven for feeling indifferent about C Cheng Holdings' P/S ratio of 0.4x, since the median price-to-sales (or "P/S") ratio for the Professional Services industry in Hong Kong is about the same. While this might not raise any eyebrows, if the P/S ratio is not justified investors could be missing out on a potential opportunity or ignoring looming disappointment.
See our latest analysis for C Cheng Holdings
What Does C Cheng Holdings' P/S Mean For Shareholders?
For example, consider that C Cheng Holdings' financial performance has been pretty ordinary lately as revenue growth is non-existent. It might be that many expect the uninspiring revenue performance to only match most other companies at best over the coming period, which has kept the P/S from rising. If you like the company, you'd be hoping this isn't the case so that you could potentially pick up some stock while it's not quite in favour.
Although there are no analyst estimates available for C Cheng Holdings, take a look at this free data-rich visualisation to see how the company stacks up on earnings, revenue and cash flow.Is There Some Revenue Growth Forecasted For C Cheng Holdings?
There's an inherent assumption that a company should be matching the industry for P/S ratios like C Cheng Holdings' to be considered reasonable.
Retrospectively, the last year delivered virtually the same number to the company's top line as the year before. The lack of growth did nothing to help the company's aggregate three-year performance, which is an unsavory 49% drop in revenue. Accordingly, shareholders would have felt downbeat about the medium-term rates of revenue growth.
Weighing that medium-term revenue trajectory against the broader industry's one-year forecast for expansion of 10% shows it's an unpleasant look.
In light of this, it's somewhat alarming that C Cheng Holdings' P/S sits in line with the majority of other companies. Apparently many investors in the company are way less bearish than recent times would indicate and aren't willing to let go of their stock right now. There's a good chance existing shareholders are setting themselves up for future disappointment if the P/S falls to levels more in line with the recent negative growth rates.
What Does C Cheng Holdings' P/S Mean For Investors?
Its shares have lifted substantially and now C Cheng Holdings' P/S is back within range of the industry median. Typically, we'd caution against reading too much into price-to-sales ratios when settling on investment decisions, though it can reveal plenty about what other market participants think about the company.
We find it unexpected that C Cheng Holdings trades at a P/S ratio that is comparable to the rest of the industry, despite experiencing declining revenues during the medium-term, while the industry as a whole is expected to grow. Even though it matches the industry, we're uncomfortable with the current P/S ratio, as this dismal revenue performance is unlikely to support a more positive sentiment for long. Unless the recent medium-term conditions improve markedly, investors will have a hard time accepting the share price as fair value.
There are also other vital risk factors to consider and we've discovered 2 warning signs for C Cheng Holdings (1 is a bit unpleasant!) that you should be aware of before investing here.
If strong companies turning a profit tickle your fancy, then you'll want to check out this free list of interesting companies that trade on a low P/E (but have proven they can grow earnings).
Have feedback on this article? Concerned about the content? Get in touch with us directly. Alternatively, email editorial-team (at) simplywallst.com.
This article by Simply Wall St is general in nature. We provide commentary based on historical data and analyst forecasts only using an unbiased methodology and our articles are not intended to be financial advice. It does not constitute a recommendation to buy or sell any stock, and does not take account of your objectives, or your financial situation. We aim to bring you long-term focused analysis driven by fundamental data. Note that our analysis may not factor in the latest price-sensitive company announcements or qualitative material. Simply Wall St has no position in any stocks mentioned.