
Angelalign Technology Inc. (HKG:6699) shares have had a really impressive month, gaining 29% after a shaky period beforehand. The last 30 days bring the annual gain to a very sharp 31%.
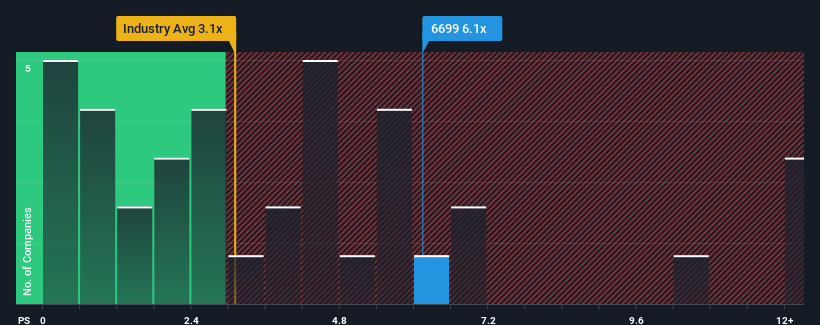
Since its price has surged higher, you could be forgiven for thinking Angelalign Technology is a stock to steer clear of with a price-to-sales ratios (or "P/S") of 6.1x, considering almost half the companies in Hong Kong's Medical Equipment industry have P/S ratios below 3.1x. Although, it's not wise to just take the P/S at face value as there may be an explanation why it's so lofty.
Check out our latest analysis for Angelalign Technology
How Angelalign Technology Has Been Performing
With revenue growth that's superior to most other companies of late, Angelalign Technology has been doing relatively well. The P/S is probably high because investors think this strong revenue performance will continue. However, if this isn't the case, investors might get caught out paying too much for the stock.
If you'd like to see what analysts are forecasting going forward, you should check out our free report on Angelalign Technology.What Are Revenue Growth Metrics Telling Us About The High P/S?
Angelalign Technology's P/S ratio would be typical for a company that's expected to deliver very strong growth, and importantly, perform much better than the industry.
If we review the last year of revenue growth, the company posted a terrific increase of 31%. The strong recent performance means it was also able to grow revenue by 60% in total over the last three years. Therefore, it's fair to say the revenue growth recently has been superb for the company.
Turning to the outlook, the next three years should generate growth of 17% per year as estimated by the analysts watching the company. With the industry predicted to deliver 23% growth per annum, the company is positioned for a weaker revenue result.
With this information, we find it concerning that Angelalign Technology is trading at a P/S higher than the industry. Apparently many investors in the company are way more bullish than analysts indicate and aren't willing to let go of their stock at any price. There's a good chance these shareholders are setting themselves up for future disappointment if the P/S falls to levels more in line with the growth outlook.
The Bottom Line On Angelalign Technology's P/S
The strong share price surge has lead to Angelalign Technology's P/S soaring as well. Generally, our preference is to limit the use of the price-to-sales ratio to establishing what the market thinks about the overall health of a company.
It comes as a surprise to see Angelalign Technology trade at such a high P/S given the revenue forecasts look less than stellar. Right now we aren't comfortable with the high P/S as the predicted future revenues aren't likely to support such positive sentiment for long. Unless these conditions improve markedly, it's very challenging to accept these prices as being reasonable.
It is also worth noting that we have found 2 warning signs for Angelalign Technology that you need to take into consideration.
If strong companies turning a profit tickle your fancy, then you'll want to check out this free list of interesting companies that trade on a low P/E (but have proven they can grow earnings).
Have feedback on this article? Concerned about the content? Get in touch with us directly. Alternatively, email editorial-team (at) simplywallst.com.
This article by Simply Wall St is general in nature. We provide commentary based on historical data and analyst forecasts only using an unbiased methodology and our articles are not intended to be financial advice. It does not constitute a recommendation to buy or sell any stock, and does not take account of your objectives, or your financial situation. We aim to bring you long-term focused analysis driven by fundamental data. Note that our analysis may not factor in the latest price-sensitive company announcements or qualitative material. Simply Wall St has no position in any stocks mentioned.