
EEKA Fashion Holdings (HKG:3709) has had a rough week with its share price down 8.5%. But if you pay close attention, you might gather that its strong financials could mean that the stock could potentially see an increase in value in the long-term, given how markets usually reward companies with good financial health. Particularly, we will be paying attention to EEKA Fashion Holdings' ROE today.
Return on equity or ROE is a key measure used to assess how efficiently a company's management is utilizing the company's capital. Put another way, it reveals the company's success at turning shareholder investments into profits.
See our latest analysis for EEKA Fashion Holdings
How Do You Calculate Return On Equity?
The formula for return on equity is:
Return on Equity = Net Profit (from continuing operations) ÷ Shareholders' Equity
So, based on the above formula, the ROE for EEKA Fashion Holdings is:
15% = CN¥673m ÷ CN¥4.4b (Based on the trailing twelve months to June 2024).
The 'return' is the yearly profit. Another way to think of that is that for every HK$1 worth of equity, the company was able to earn HK$0.15 in profit.
What Has ROE Got To Do With Earnings Growth?
So far, we've learned that ROE is a measure of a company's profitability. We now need to evaluate how much profit the company reinvests or "retains" for future growth which then gives us an idea about the growth potential of the company. Generally speaking, other things being equal, firms with a high return on equity and profit retention, have a higher growth rate than firms that don’t share these attributes.
EEKA Fashion Holdings' Earnings Growth And 15% ROE
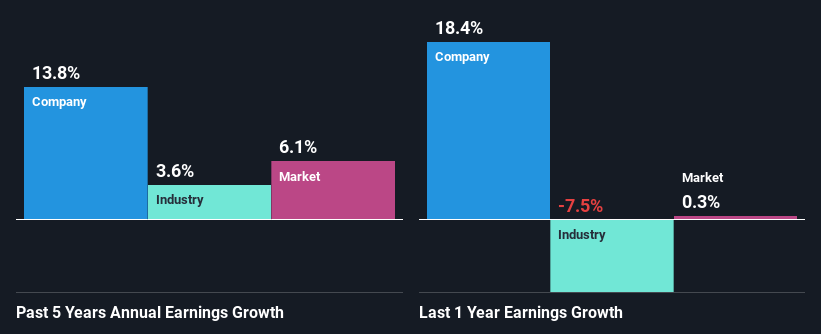
To start with, EEKA Fashion Holdings' ROE looks acceptable. Further, the company's ROE compares quite favorably to the industry average of 8.3%. This certainly adds some context to EEKA Fashion Holdings' decent 14% net income growth seen over the past five years.
Next, on comparing with the industry net income growth, we found that EEKA Fashion Holdings' growth is quite high when compared to the industry average growth of 3.6% in the same period, which is great to see.
Earnings growth is an important metric to consider when valuing a stock. The investor should try to establish if the expected growth or decline in earnings, whichever the case may be, is priced in. Doing so will help them establish if the stock's future looks promising or ominous. One good indicator of expected earnings growth is the P/E ratio which determines the price the market is willing to pay for a stock based on its earnings prospects. So, you may want to check if EEKA Fashion Holdings is trading on a high P/E or a low P/E, relative to its industry.
Is EEKA Fashion Holdings Making Efficient Use Of Its Profits?
With a three-year median payout ratio of 49% (implying that the company retains 51% of its profits), it seems that EEKA Fashion Holdings is reinvesting efficiently in a way that it sees respectable amount growth in its earnings and pays a dividend that's well covered.
Besides, EEKA Fashion Holdings has been paying dividends for at least ten years or more. This shows that the company is committed to sharing profits with its shareholders.
Conclusion
Overall, we are quite pleased with EEKA Fashion Holdings' performance. In particular, it's great to see that the company is investing heavily into its business and along with a high rate of return, that has resulted in a sizeable growth in its earnings. We also studied the latest analyst forecasts and found that the company's earnings growth is expected be similar to its current growth rate. Are these analysts expectations based on the broad expectations for the industry, or on the company's fundamentals? Click here to be taken to our analyst's forecasts page for the company.
Have feedback on this article? Concerned about the content? Get in touch with us directly. Alternatively, email editorial-team (at) simplywallst.com.
This article by Simply Wall St is general in nature. We provide commentary based on historical data and analyst forecasts only using an unbiased methodology and our articles are not intended to be financial advice. It does not constitute a recommendation to buy or sell any stock, and does not take account of your objectives, or your financial situation. We aim to bring you long-term focused analysis driven by fundamental data. Note that our analysis may not factor in the latest price-sensitive company announcements or qualitative material. Simply Wall St has no position in any stocks mentioned.