
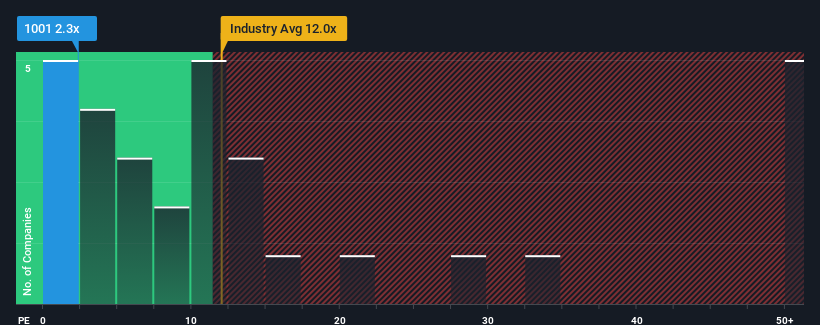
Hong Kong Shanghai Alliance Holdings Limited's (HKG:1001) price-to-earnings (or "P/E") ratio of 2.3x might make it look like a strong buy right now compared to the market in Hong Kong, where around half of the companies have P/E ratios above 12x and even P/E's above 23x are quite common. Nonetheless, we'd need to dig a little deeper to determine if there is a rational basis for the highly reduced P/E.
As an illustration, earnings have deteriorated at Hong Kong Shanghai Alliance Holdings over the last year, which is not ideal at all. It might be that many expect the disappointing earnings performance to continue or accelerate, which has repressed the P/E. However, if this doesn't eventuate then existing shareholders may be feeling optimistic about the future direction of the share price.
See our latest analysis for Hong Kong Shanghai Alliance Holdings
Is There Any Growth For Hong Kong Shanghai Alliance Holdings?
Hong Kong Shanghai Alliance Holdings' P/E ratio would be typical for a company that's expected to deliver very poor growth or even falling earnings, and importantly, perform much worse than the market.
Taking a look back first, the company's earnings per share growth last year wasn't something to get excited about as it posted a disappointing decline of 4.9%. However, a few very strong years before that means that it was still able to grow EPS by an impressive 4,644% in total over the last three years. So we can start by confirming that the company has generally done a very good job of growing earnings over that time, even though it had some hiccups along the way.
Weighing that recent medium-term earnings trajectory against the broader market's one-year forecast for expansion of 22% shows it's noticeably more attractive on an annualised basis.
In light of this, it's peculiar that Hong Kong Shanghai Alliance Holdings' P/E sits below the majority of other companies. Apparently some shareholders believe the recent performance has exceeded its limits and have been accepting significantly lower selling prices.
What We Can Learn From Hong Kong Shanghai Alliance Holdings' P/E?
While the price-to-earnings ratio shouldn't be the defining factor in whether you buy a stock or not, it's quite a capable barometer of earnings expectations.
Our examination of Hong Kong Shanghai Alliance Holdings revealed its three-year earnings trends aren't contributing to its P/E anywhere near as much as we would have predicted, given they look better than current market expectations. There could be some major unobserved threats to earnings preventing the P/E ratio from matching this positive performance. At least price risks look to be very low if recent medium-term earnings trends continue, but investors seem to think future earnings could see a lot of volatility.
Before you settle on your opinion, we've discovered 3 warning signs for Hong Kong Shanghai Alliance Holdings (1 makes us a bit uncomfortable!) that you should be aware of.
If these risks are making you reconsider your opinion on Hong Kong Shanghai Alliance Holdings, explore our interactive list of high quality stocks to get an idea of what else is out there.
Have feedback on this article? Concerned about the content? Get in touch with us directly. Alternatively, email editorial-team (at) simplywallst.com.
This article by Simply Wall St is general in nature. We provide commentary based on historical data and analyst forecasts only using an unbiased methodology and our articles are not intended to be financial advice. It does not constitute a recommendation to buy or sell any stock, and does not take account of your objectives, or your financial situation. We aim to bring you long-term focused analysis driven by fundamental data. Note that our analysis may not factor in the latest price-sensitive company announcements or qualitative material. Simply Wall St has no position in any stocks mentioned.