
E&P Global Holdings Limited (HKG:1142) shareholders would be excited to see that the share price has had a great month, posting a 154% gain and recovering from prior weakness. The last 30 days bring the annual gain to a very sharp 42%.
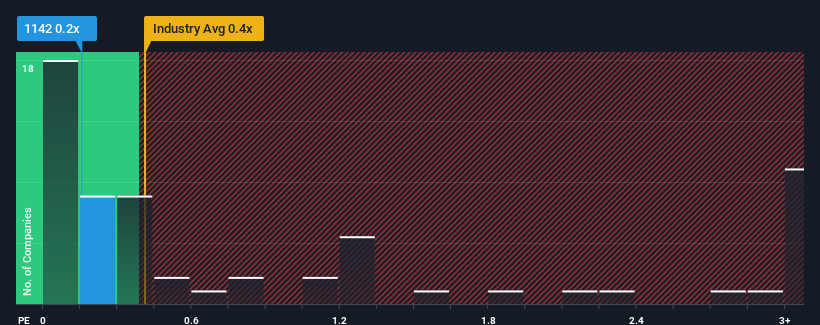
In spite of the firm bounce in price, you could still be forgiven for feeling indifferent about E&P Global Holdings' P/S ratio of 0.2x, since the median price-to-sales (or "P/S") ratio for the Trade Distributors industry in Hong Kong is also close to 0.4x. While this might not raise any eyebrows, if the P/S ratio is not justified investors could be missing out on a potential opportunity or ignoring looming disappointment.
Check out our latest analysis for E&P Global Holdings
What Does E&P Global Holdings' P/S Mean For Shareholders?
As an illustration, revenue has deteriorated at E&P Global Holdings over the last year, which is not ideal at all. One possibility is that the P/S is moderate because investors think the company might still do enough to be in line with the broader industry in the near future. If you like the company, you'd at least be hoping this is the case so that you could potentially pick up some stock while it's not quite in favour.
Want the full picture on earnings, revenue and cash flow for the company? Then our free report on E&P Global Holdings will help you shine a light on its historical performance.What Are Revenue Growth Metrics Telling Us About The P/S?
The only time you'd be comfortable seeing a P/S like E&P Global Holdings' is when the company's growth is tracking the industry closely.
Taking a look back first, the company's revenue growth last year wasn't something to get excited about as it posted a disappointing decline of 42%. This means it has also seen a slide in revenue over the longer-term as revenue is down 47% in total over the last three years. So unfortunately, we have to acknowledge that the company has not done a great job of growing revenue over that time.
In contrast to the company, the rest of the industry is expected to grow by 21% over the next year, which really puts the company's recent medium-term revenue decline into perspective.
In light of this, it's somewhat alarming that E&P Global Holdings' P/S sits in line with the majority of other companies. Apparently many investors in the company are way less bearish than recent times would indicate and aren't willing to let go of their stock right now. There's a good chance existing shareholders are setting themselves up for future disappointment if the P/S falls to levels more in line with the recent negative growth rates.
The Bottom Line On E&P Global Holdings' P/S
E&P Global Holdings appears to be back in favour with a solid price jump bringing its P/S back in line with other companies in the industry Using the price-to-sales ratio alone to determine if you should sell your stock isn't sensible, however it can be a practical guide to the company's future prospects.
We find it unexpected that E&P Global Holdings trades at a P/S ratio that is comparable to the rest of the industry, despite experiencing declining revenues during the medium-term, while the industry as a whole is expected to grow. Even though it matches the industry, we're uncomfortable with the current P/S ratio, as this dismal revenue performance is unlikely to support a more positive sentiment for long. Unless the recent medium-term conditions improve markedly, investors will have a hard time accepting the share price as fair value.
Having said that, be aware E&P Global Holdings is showing 5 warning signs in our investment analysis, and 3 of those can't be ignored.
It's important to make sure you look for a great company, not just the first idea you come across. So if growing profitability aligns with your idea of a great company, take a peek at this free list of interesting companies with strong recent earnings growth (and a low P/E).
Have feedback on this article? Concerned about the content? Get in touch with us directly. Alternatively, email editorial-team (at) simplywallst.com.
This article by Simply Wall St is general in nature. We provide commentary based on historical data and analyst forecasts only using an unbiased methodology and our articles are not intended to be financial advice. It does not constitute a recommendation to buy or sell any stock, and does not take account of your objectives, or your financial situation. We aim to bring you long-term focused analysis driven by fundamental data. Note that our analysis may not factor in the latest price-sensitive company announcements or qualitative material. Simply Wall St has no position in any stocks mentioned.