
It is hard to get excited after looking at Xin Yuan Enterprises Group's (HKG:1748) recent performance, when its stock has declined 81% over the past month. However, the company's fundamentals look pretty decent, and long-term financials are usually aligned with future market price movements. In this article, we decided to focus on Xin Yuan Enterprises Group's ROE.
Return on equity or ROE is a key measure used to assess how efficiently a company's management is utilizing the company's capital. In other words, it is a profitability ratio which measures the rate of return on the capital provided by the company's shareholders.
Check out our latest analysis for Xin Yuan Enterprises Group
How Do You Calculate Return On Equity?
The formula for return on equity is:
Return on Equity = Net Profit (from continuing operations) ÷ Shareholders' Equity
So, based on the above formula, the ROE for Xin Yuan Enterprises Group is:
10% = US$14m ÷ US$135m (Based on the trailing twelve months to June 2024).
The 'return' is the income the business earned over the last year. That means that for every HK$1 worth of shareholders' equity, the company generated HK$0.10 in profit.
What Is The Relationship Between ROE And Earnings Growth?
Thus far, we have learned that ROE measures how efficiently a company is generating its profits. Depending on how much of these profits the company reinvests or "retains", and how effectively it does so, we are then able to assess a company’s earnings growth potential. Generally speaking, other things being equal, firms with a high return on equity and profit retention, have a higher growth rate than firms that don’t share these attributes.
Xin Yuan Enterprises Group's Earnings Growth And 10% ROE
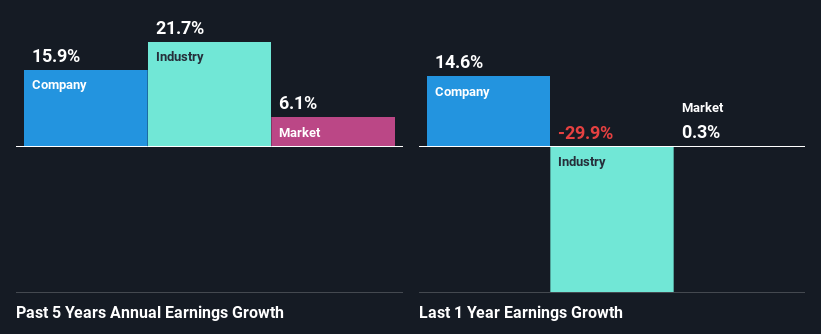
On the face of it, Xin Yuan Enterprises Group's ROE is not much to talk about. Yet, a closer study shows that the company's ROE is similar to the industry average of 9.6%. On the other hand, Xin Yuan Enterprises Group reported a moderate 16% net income growth over the past five years. Considering the moderately low ROE, it is quite possible that there might be some other aspects that are positively influencing the company's earnings growth. Such as - high earnings retention or an efficient management in place.
As a next step, we compared Xin Yuan Enterprises Group's net income growth with the industry and were disappointed to see that the company's growth is lower than the industry average growth of 22% in the same period.
The basis for attaching value to a company is, to a great extent, tied to its earnings growth. What investors need to determine next is if the expected earnings growth, or the lack of it, is already built into the share price. By doing so, they will have an idea if the stock is headed into clear blue waters or if swampy waters await. If you're wondering about Xin Yuan Enterprises Group's's valuation, check out this gauge of its price-to-earnings ratio, as compared to its industry.
Is Xin Yuan Enterprises Group Using Its Retained Earnings Effectively?
Xin Yuan Enterprises Group doesn't pay any regular dividends, meaning that all of its profits are being reinvested in the business, which explains the fair bit of earnings growth the company has seen.
Conclusion
In total, it does look like Xin Yuan Enterprises Group has some positive aspects to its business. Specifically, its fairly high earnings growth number, which no doubt was backed by the company's high earnings retention. Still, the low ROE means that all that reinvestment is not reaping a lot of benefit to the investors. While we won't completely dismiss the company, what we would do, is try to ascertain how risky the business is to make a more informed decision around the company. To know the 1 risk we have identified for Xin Yuan Enterprises Group visit our risks dashboard for free.
Have feedback on this article? Concerned about the content? Get in touch with us directly. Alternatively, email editorial-team (at) simplywallst.com.
This article by Simply Wall St is general in nature. We provide commentary based on historical data and analyst forecasts only using an unbiased methodology and our articles are not intended to be financial advice. It does not constitute a recommendation to buy or sell any stock, and does not take account of your objectives, or your financial situation. We aim to bring you long-term focused analysis driven by fundamental data. Note that our analysis may not factor in the latest price-sensitive company announcements or qualitative material. Simply Wall St has no position in any stocks mentioned.