
The Alphamab Oncology (HKG:9966) share price has done very well over the last month, posting an excellent gain of 91%. Unfortunately, the gains of the last month did little to right the losses of the last year with the stock still down 45% over that time.
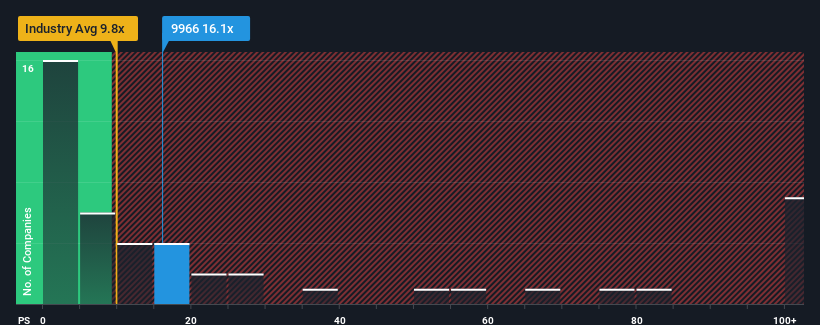
After such a large jump in price, Alphamab Oncology may be sending very bearish signals at the moment with a price-to-sales (or "P/S") ratio of 16.1x, since almost half of all companies in the Biotechs industry in Hong Kong have P/S ratios under 9.8x and even P/S lower than 2x are not unusual. Nonetheless, we'd need to dig a little deeper to determine if there is a rational basis for the highly elevated P/S.
See our latest analysis for Alphamab Oncology
What Does Alphamab Oncology's Recent Performance Look Like?
With revenue growth that's inferior to most other companies of late, Alphamab Oncology has been relatively sluggish. Perhaps the market is expecting future revenue performance to undergo a reversal of fortunes, which has elevated the P/S ratio. However, if this isn't the case, investors might get caught out paying too much for the stock.
If you'd like to see what analysts are forecasting going forward, you should check out our free report on Alphamab Oncology.Do Revenue Forecasts Match The High P/S Ratio?
Alphamab Oncology's P/S ratio would be typical for a company that's expected to deliver very strong growth, and importantly, perform much better than the industry.
Taking a look back first, we see that there was hardly any revenue growth to speak of for the company over the past year. Likewise, not much has changed from three years ago as revenue have been stuck during that whole time. Therefore, it's fair to say that revenue growth has definitely eluded the company recently.
Shifting to the future, estimates from the three analysts covering the company suggest revenue should grow by 67% each year over the next three years. With the industry only predicted to deliver 52% each year, the company is positioned for a stronger revenue result.
With this information, we can see why Alphamab Oncology is trading at such a high P/S compared to the industry. Apparently shareholders aren't keen to offload something that is potentially eyeing a more prosperous future.
What We Can Learn From Alphamab Oncology's P/S?
Shares in Alphamab Oncology have seen a strong upwards swing lately, which has really helped boost its P/S figure. While the price-to-sales ratio shouldn't be the defining factor in whether you buy a stock or not, it's quite a capable barometer of revenue expectations.
We've established that Alphamab Oncology maintains its high P/S on the strength of its forecasted revenue growth being higher than the the rest of the Biotechs industry, as expected. Right now shareholders are comfortable with the P/S as they are quite confident future revenues aren't under threat. Unless these conditions change, they will continue to provide strong support to the share price.
You should always think about risks. Case in point, we've spotted 1 warning sign for Alphamab Oncology you should be aware of.
If you're unsure about the strength of Alphamab Oncology's business, why not explore our interactive list of stocks with solid business fundamentals for some other companies you may have missed.
Have feedback on this article? Concerned about the content? Get in touch with us directly. Alternatively, email editorial-team (at) simplywallst.com.
This article by Simply Wall St is general in nature. We provide commentary based on historical data and analyst forecasts only using an unbiased methodology and our articles are not intended to be financial advice. It does not constitute a recommendation to buy or sell any stock, and does not take account of your objectives, or your financial situation. We aim to bring you long-term focused analysis driven by fundamental data. Note that our analysis may not factor in the latest price-sensitive company announcements or qualitative material. Simply Wall St has no position in any stocks mentioned.