
Those holding FriendTimes Inc. (HKG:6820) shares would be relieved that the share price has rebounded 27% in the last thirty days, but it needs to keep going to repair the recent damage it has caused to investor portfolios. Not all shareholders will be feeling jubilant, since the share price is still down a very disappointing 21% in the last twelve months.
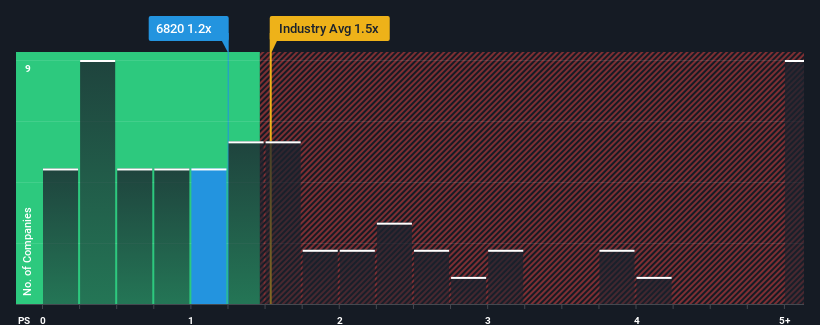
In spite of the firm bounce in price, it's still not a stretch to say that FriendTimes' price-to-sales (or "P/S") ratio of 1.2x right now seems quite "middle-of-the-road" compared to the Entertainment industry in Hong Kong, where the median P/S ratio is around 1.5x. While this might not raise any eyebrows, if the P/S ratio is not justified investors could be missing out on a potential opportunity or ignoring looming disappointment.
See our latest analysis for FriendTimes
How FriendTimes Has Been Performing
FriendTimes hasn't been tracking well recently as its declining revenue compares poorly to other companies, which have seen some growth in their revenues on average. It might be that many expect the dour revenue performance to strengthen positively, which has kept the P/S from falling. You'd really hope so, otherwise you're paying a relatively elevated price for a company with this sort of growth profile.
If you'd like to see what analysts are forecasting going forward, you should check out our free report on FriendTimes.Do Revenue Forecasts Match The P/S Ratio?
There's an inherent assumption that a company should be matching the industry for P/S ratios like FriendTimes' to be considered reasonable.
In reviewing the last year of financials, we were disheartened to see the company's revenues fell to the tune of 27%. The last three years don't look nice either as the company has shrunk revenue by 51% in aggregate. So unfortunately, we have to acknowledge that the company has not done a great job of growing revenue over that time.
Turning to the outlook, the next year should generate growth of 56% as estimated by the dual analysts watching the company. With the industry only predicted to deliver 39%, the company is positioned for a stronger revenue result.
With this in consideration, we find it intriguing that FriendTimes' P/S is closely matching its industry peers. It may be that most investors aren't convinced the company can achieve future growth expectations.
The Key Takeaway
Its shares have lifted substantially and now FriendTimes' P/S is back within range of the industry median. While the price-to-sales ratio shouldn't be the defining factor in whether you buy a stock or not, it's quite a capable barometer of revenue expectations.
Looking at FriendTimes' analyst forecasts revealed that its superior revenue outlook isn't giving the boost to its P/S that we would've expected. Perhaps uncertainty in the revenue forecasts are what's keeping the P/S ratio consistent with the rest of the industry. It appears some are indeed anticipating revenue instability, because these conditions should normally provide a boost to the share price.
Before you take the next step, you should know about the 1 warning sign for FriendTimes that we have uncovered.
If companies with solid past earnings growth is up your alley, you may wish to see this free collection of other companies with strong earnings growth and low P/E ratios.
Have feedback on this article? Concerned about the content? Get in touch with us directly. Alternatively, email editorial-team (at) simplywallst.com.
This article by Simply Wall St is general in nature. We provide commentary based on historical data and analyst forecasts only using an unbiased methodology and our articles are not intended to be financial advice. It does not constitute a recommendation to buy or sell any stock, and does not take account of your objectives, or your financial situation. We aim to bring you long-term focused analysis driven by fundamental data. Note that our analysis may not factor in the latest price-sensitive company announcements or qualitative material. Simply Wall St has no position in any stocks mentioned.