
EFT Solutions Holdings (HKG:8062) has had a rough three months with its share price down 28%. However, a closer look at its sound financials might cause you to think again. Given that fundamentals usually drive long-term market outcomes, the company is worth looking at. Specifically, we decided to study EFT Solutions Holdings' ROE in this article.
ROE or return on equity is a useful tool to assess how effectively a company can generate returns on the investment it received from its shareholders. In short, ROE shows the profit each dollar generates with respect to its shareholder investments.
Check out our latest analysis for EFT Solutions Holdings
How Do You Calculate Return On Equity?
Return on equity can be calculated by using the formula:
Return on Equity = Net Profit (from continuing operations) ÷ Shareholders' Equity
So, based on the above formula, the ROE for EFT Solutions Holdings is:
22% = HK$32m ÷ HK$142m (Based on the trailing twelve months to March 2024).
The 'return' is the yearly profit. Another way to think of that is that for every HK$1 worth of equity, the company was able to earn HK$0.22 in profit.
Why Is ROE Important For Earnings Growth?
Thus far, we have learned that ROE measures how efficiently a company is generating its profits. Based on how much of its profits the company chooses to reinvest or "retain", we are then able to evaluate a company's future ability to generate profits. Generally speaking, other things being equal, firms with a high return on equity and profit retention, have a higher growth rate than firms that don’t share these attributes.
A Side By Side comparison of EFT Solutions Holdings' Earnings Growth And 22% ROE
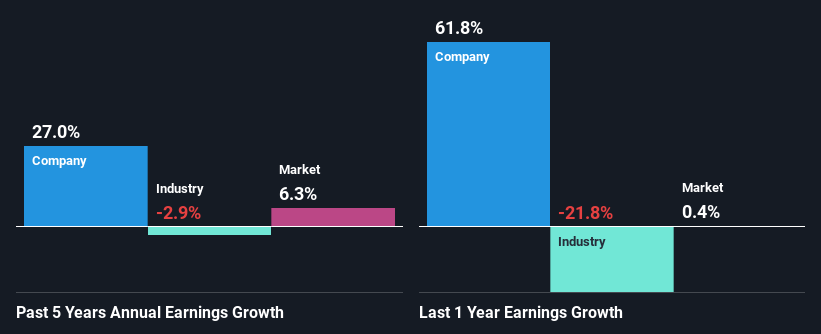
At first glance, EFT Solutions Holdings seems to have a decent ROE. On comparing with the average industry ROE of 5.9% the company's ROE looks pretty remarkable. This certainly adds some context to EFT Solutions Holdings' exceptional 27% net income growth seen over the past five years. We reckon that there could also be other factors at play here. For instance, the company has a low payout ratio or is being managed efficiently.
When you consider the fact that the industry earnings have shrunk at a rate of 2.9% in the same 5-year period, the company's net income growth is pretty remarkable.
The basis for attaching value to a company is, to a great extent, tied to its earnings growth. What investors need to determine next is if the expected earnings growth, or the lack of it, is already built into the share price. This then helps them determine if the stock is placed for a bright or bleak future. Is EFT Solutions Holdings fairly valued compared to other companies? These 3 valuation measures might help you decide.
Is EFT Solutions Holdings Efficiently Re-investing Its Profits?
The high three-year median payout ratio of 75% (implying that it keeps only 25% of profits) for EFT Solutions Holdings suggests that the company's growth wasn't really hampered despite it returning most of the earnings to its shareholders.
Moreover, EFT Solutions Holdings is determined to keep sharing its profits with shareholders which we infer from its long history of four years of paying a dividend.
Summary
On the whole, we feel that EFT Solutions Holdings' performance has been quite good. In particular, its high ROE is quite noteworthy and also the probable explanation behind its considerable earnings growth. Yet, the company is retaining a small portion of its profits. Which means that the company has been able to grow its earnings in spite of it, so that's not too bad. Until now, we have only just grazed the surface of the company's past performance by looking at the company's fundamentals. To gain further insights into EFT Solutions Holdings' past profit growth, check out this visualization of past earnings, revenue and cash flows.
Have feedback on this article? Concerned about the content? Get in touch with us directly. Alternatively, email editorial-team (at) simplywallst.com.
This article by Simply Wall St is general in nature. We provide commentary based on historical data and analyst forecasts only using an unbiased methodology and our articles are not intended to be financial advice. It does not constitute a recommendation to buy or sell any stock, and does not take account of your objectives, or your financial situation. We aim to bring you long-term focused analysis driven by fundamental data. Note that our analysis may not factor in the latest price-sensitive company announcements or qualitative material. Simply Wall St has no position in any stocks mentioned.