
Despite an already strong run, Hing Yip Holdings Limited (HKG:132) shares have been powering on, with a gain of 45% in the last thirty days. Looking back a bit further, it's encouraging to see the stock is up 51% in the last year.
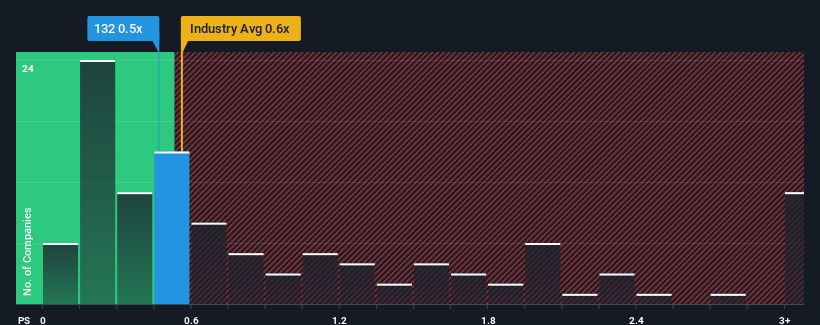
Even after such a large jump in price, you could still be forgiven for feeling indifferent about Hing Yip Holdings' P/S ratio of 0.5x, since the median price-to-sales (or "P/S") ratio for the Hospitality industry in Hong Kong is also close to 0.6x. Although, it's not wise to simply ignore the P/S without explanation as investors may be disregarding a distinct opportunity or a costly mistake.
View our latest analysis for Hing Yip Holdings
How Hing Yip Holdings Has Been Performing
The recent revenue growth at Hing Yip Holdings would have to be considered satisfactory if not spectacular. It might be that many expect the respectable revenue performance to only match most other companies over the coming period, which has kept the P/S from rising. If you like the company, you'd be hoping this isn't the case so that you could potentially pick up some stock while it's not quite in favour.
Want the full picture on earnings, revenue and cash flow for the company? Then our free report on Hing Yip Holdings will help you shine a light on its historical performance.Do Revenue Forecasts Match The P/S Ratio?
In order to justify its P/S ratio, Hing Yip Holdings would need to produce growth that's similar to the industry.
Retrospectively, the last year delivered a decent 4.6% gain to the company's revenues. This was backed up an excellent period prior to see revenue up by 115% in total over the last three years. Accordingly, shareholders would have definitely welcomed those medium-term rates of revenue growth.
When compared to the industry's one-year growth forecast of 16%, the most recent medium-term revenue trajectory is noticeably more alluring
In light of this, it's curious that Hing Yip Holdings' P/S sits in line with the majority of other companies. Apparently some shareholders believe the recent performance is at its limits and have been accepting lower selling prices.
The Bottom Line On Hing Yip Holdings' P/S
Hing Yip Holdings appears to be back in favour with a solid price jump bringing its P/S back in line with other companies in the industry It's argued the price-to-sales ratio is an inferior measure of value within certain industries, but it can be a powerful business sentiment indicator.
To our surprise, Hing Yip Holdings revealed its three-year revenue trends aren't contributing to its P/S as much as we would have predicted, given they look better than current industry expectations. It'd be fair to assume that potential risks the company faces could be the contributing factor to the lower than expected P/S. At least the risk of a price drop looks to be subdued if recent medium-term revenue trends continue, but investors seem to think future revenue could see some volatility.
Having said that, be aware Hing Yip Holdings is showing 4 warning signs in our investment analysis, and 3 of those shouldn't be ignored.
If you're unsure about the strength of Hing Yip Holdings' business, why not explore our interactive list of stocks with solid business fundamentals for some other companies you may have missed.
Have feedback on this article? Concerned about the content? Get in touch with us directly. Alternatively, email editorial-team (at) simplywallst.com.
This article by Simply Wall St is general in nature. We provide commentary based on historical data and analyst forecasts only using an unbiased methodology and our articles are not intended to be financial advice. It does not constitute a recommendation to buy or sell any stock, and does not take account of your objectives, or your financial situation. We aim to bring you long-term focused analysis driven by fundamental data. Note that our analysis may not factor in the latest price-sensitive company announcements or qualitative material. Simply Wall St has no position in any stocks mentioned.