
To the annoyance of some shareholders, Hidili Industry International Development Limited (HKG:1393) shares are down a considerable 27% in the last month, which continues a horrid run for the company. The recent drop completes a disastrous twelve months for shareholders, who are sitting on a 59% loss during that time.
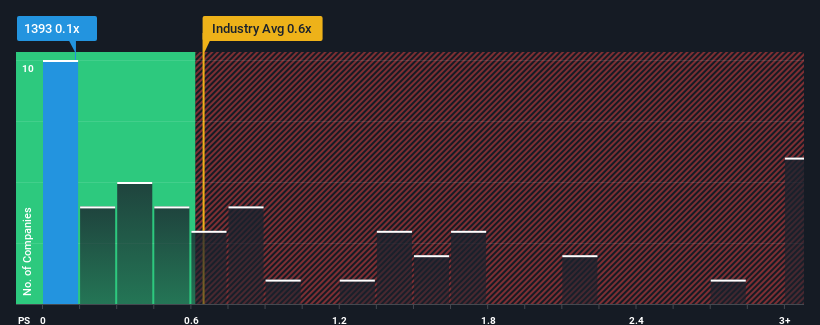
Since its price has dipped substantially, when close to half the companies operating in Hong Kong's Oil and Gas industry have price-to-sales ratios (or "P/S") above 0.6x, you may consider Hidili Industry International Development as an enticing stock to check out with its 0.1x P/S ratio. Nonetheless, we'd need to dig a little deeper to determine if there is a rational basis for the reduced P/S.
Check out our latest analysis for Hidili Industry International Development
How Hidili Industry International Development Has Been Performing
As an illustration, revenue has deteriorated at Hidili Industry International Development over the last year, which is not ideal at all. One possibility is that the P/S is low because investors think the company won't do enough to avoid underperforming the broader industry in the near future. However, if this doesn't eventuate then existing shareholders may be feeling optimistic about the future direction of the share price.
Although there are no analyst estimates available for Hidili Industry International Development, take a look at this free data-rich visualisation to see how the company stacks up on earnings, revenue and cash flow.What Are Revenue Growth Metrics Telling Us About The Low P/S?
Hidili Industry International Development's P/S ratio would be typical for a company that's only expected to deliver limited growth, and importantly, perform worse than the industry.
Taking a look back first, the company's revenue growth last year wasn't something to get excited about as it posted a disappointing decline of 44%. Unfortunately, that's brought it right back to where it started three years ago with revenue growth being virtually non-existent overall during that time. So it appears to us that the company has had a mixed result in terms of growing revenue over that time.
Weighing that recent medium-term revenue trajectory against the broader industry's one-year forecast for expansion of 1.4% shows it's about the same on an annualised basis.
With this in consideration, we find it intriguing that Hidili Industry International Development's P/S falls short of its industry peers. Apparently some shareholders are more bearish than recent times would indicate and have been accepting lower selling prices.
The Bottom Line On Hidili Industry International Development's P/S
Hidili Industry International Development's recently weak share price has pulled its P/S back below other Oil and Gas companies. Typically, we'd caution against reading too much into price-to-sales ratios when settling on investment decisions, though it can reveal plenty about what other market participants think about the company.
Our examination of Hidili Industry International Development revealed its three-year revenue trends looking similar to current industry expectations hasn't given the P/S the boost we expected, given that it's lower than the wider industry P/S, When we see industry-like revenue growth but a lower than expected P/S, we assume potential risks are what might be placing downward pressure on the share price. It appears some are indeed anticipating revenue instability, because the persistence of these recent medium-term conditions should normally provide more support to the share price.
It is also worth noting that we have found 2 warning signs for Hidili Industry International Development (1 doesn't sit too well with us!) that you need to take into consideration.
Of course, profitable companies with a history of great earnings growth are generally safer bets. So you may wish to see this free collection of other companies that have reasonable P/E ratios and have grown earnings strongly.
Have feedback on this article? Concerned about the content? Get in touch with us directly. Alternatively, email editorial-team (at) simplywallst.com.
This article by Simply Wall St is general in nature. We provide commentary based on historical data and analyst forecasts only using an unbiased methodology and our articles are not intended to be financial advice. It does not constitute a recommendation to buy or sell any stock, and does not take account of your objectives, or your financial situation. We aim to bring you long-term focused analysis driven by fundamental data. Note that our analysis may not factor in the latest price-sensitive company announcements or qualitative material. Simply Wall St has no position in any stocks mentioned.