
One of the frustrations of investing is when a stock goes down. But it can difficult to make money in a declining market. While the Vtech Holdings Limited (HKG:303) share price is down 32% in the last three years, the total return to shareholders (which includes dividends) was -9.3%. And that total return actually beats the market decline of 17%.
The recent uptick of 3.7% could be a positive sign of things to come, so let's take a look at historical fundamentals.
View our latest analysis for Vtech Holdings
While markets are a powerful pricing mechanism, share prices reflect investor sentiment, not just underlying business performance. One flawed but reasonable way to assess how sentiment around a company has changed is to compare the earnings per share (EPS) with the share price.
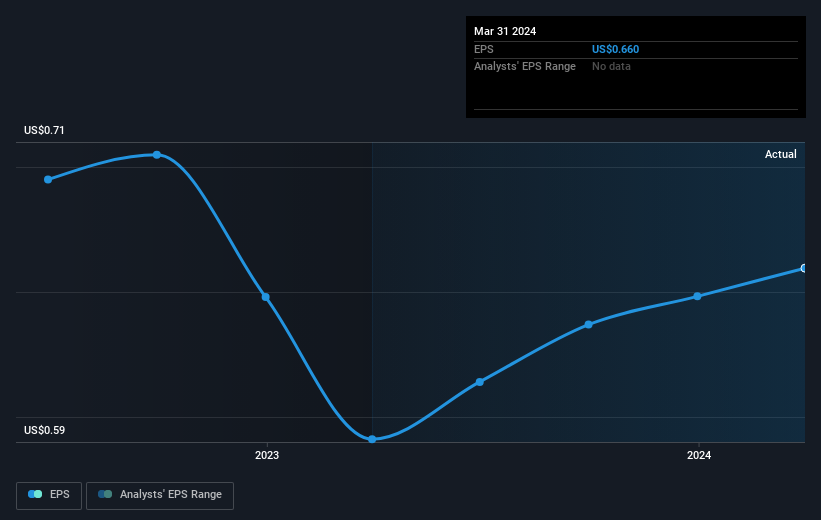
During the three years that the share price fell, Vtech Holdings' earnings per share (EPS) dropped by 10% each year. This change in EPS is reasonably close to the 12% average annual decrease in the share price. That suggests that the market sentiment around the company hasn't changed much over that time, despite the disappointment. It seems like the share price is reflecting the declining earnings per share.
The image below shows how EPS has tracked over time (if you click on the image you can see greater detail).
We know that Vtech Holdings has improved its bottom line lately, but is it going to grow revenue? This free report showing analyst revenue forecasts should help you figure out if the EPS growth can be sustained.
What About Dividends?
It is important to consider the total shareholder return, as well as the share price return, for any given stock. The TSR is a return calculation that accounts for the value of cash dividends (assuming that any dividend received was reinvested) and the calculated value of any discounted capital raisings and spin-offs. So for companies that pay a generous dividend, the TSR is often a lot higher than the share price return. As it happens, Vtech Holdings' TSR for the last 3 years was -9.3%, which exceeds the share price return mentioned earlier. This is largely a result of its dividend payments!
A Different Perspective
We're pleased to report that Vtech Holdings shareholders have received a total shareholder return of 20% over one year. And that does include the dividend. That's better than the annualised return of 4% over half a decade, implying that the company is doing better recently. In the best case scenario, this may hint at some real business momentum, implying that now could be a great time to delve deeper. I find it very interesting to look at share price over the long term as a proxy for business performance. But to truly gain insight, we need to consider other information, too. Consider for instance, the ever-present spectre of investment risk. We've identified 2 warning signs with Vtech Holdings (at least 1 which doesn't sit too well with us) , and understanding them should be part of your investment process.
If you are like me, then you will not want to miss this free list of undervalued small caps that insiders are buying.
Please note, the market returns quoted in this article reflect the market weighted average returns of stocks that currently trade on Hong Kong exchanges.
Have feedback on this article? Concerned about the content? Get in touch with us directly. Alternatively, email editorial-team (at) simplywallst.com.
This article by Simply Wall St is general in nature. We provide commentary based on historical data and analyst forecasts only using an unbiased methodology and our articles are not intended to be financial advice. It does not constitute a recommendation to buy or sell any stock, and does not take account of your objectives, or your financial situation. We aim to bring you long-term focused analysis driven by fundamental data. Note that our analysis may not factor in the latest price-sensitive company announcements or qualitative material. Simply Wall St has no position in any stocks mentioned.