
Finding a business that has the potential to grow substantially is not easy, but it is possible if we look at a few key financial metrics. Firstly, we'll want to see a proven return on capital employed (ROCE) that is increasing, and secondly, an expanding base of capital employed. Put simply, these types of businesses are compounding machines, meaning they are continually reinvesting their earnings at ever-higher rates of return. However, after briefly looking over the numbers, we don't think China Oil And Gas Group (HKG:603) has the makings of a multi-bagger going forward, but let's have a look at why that may be.
Understanding Return On Capital Employed (ROCE)
For those who don't know, ROCE is a measure of a company's yearly pre-tax profit (its return), relative to the capital employed in the business. The formula for this calculation on China Oil And Gas Group is:
Return on Capital Employed = Earnings Before Interest and Tax (EBIT) ÷ (Total Assets - Current Liabilities)
0.085 = HK$1.0b ÷ (HK$21b - HK$8.6b) (Based on the trailing twelve months to December 2023).
Therefore, China Oil And Gas Group has an ROCE of 8.5%. Even though it's in line with the industry average of 8.4%, it's still a low return by itself.
See our latest analysis for China Oil And Gas Group
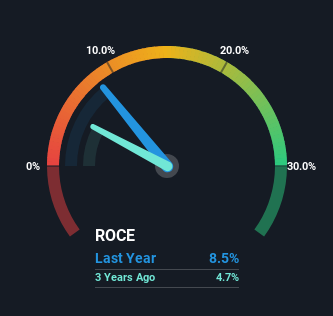
While the past is not representative of the future, it can be helpful to know how a company has performed historically, which is why we have this chart above. If you'd like to look at how China Oil And Gas Group has performed in the past in other metrics, you can view this free graph of China Oil And Gas Group's past earnings, revenue and cash flow.
How Are Returns Trending?
Things have been pretty stable at China Oil And Gas Group, with its capital employed and returns on that capital staying somewhat the same for the last five years. It's not uncommon to see this when looking at a mature and stable business that isn't re-investing its earnings because it has likely passed that phase of the business cycle. So unless we see a substantial change at China Oil And Gas Group in terms of ROCE and additional investments being made, we wouldn't hold our breath on it being a multi-bagger.
On another note, while the change in ROCE trend might not scream for attention, it's interesting that the current liabilities have actually gone up over the last five years. This is intriguing because if current liabilities hadn't increased to 41% of total assets, this reported ROCE would probably be less than8.5% because total capital employed would be higher.The 8.5% ROCE could be even lower if current liabilities weren't 41% of total assets, because the the formula would show a larger base of total capital employed. Additionally, this high level of current liabilities isn't ideal because it means the company's suppliers (or short-term creditors) are effectively funding a large portion of the business.
Our Take On China Oil And Gas Group's ROCE
We can conclude that in regards to China Oil And Gas Group's returns on capital employed and the trends, there isn't much change to report on. And investors appear hesitant that the trends will pick up because the stock has fallen 13% in the last five years. In any case, the stock doesn't have these traits of a multi-bagger discussed above, so if that's what you're looking for, we think you'd have more luck elsewhere.
If you want to continue researching China Oil And Gas Group, you might be interested to know about the 1 warning sign that our analysis has discovered.
While China Oil And Gas Group may not currently earn the highest returns, we've compiled a list of companies that currently earn more than 25% return on equity. Check out this free list here.
Have feedback on this article? Concerned about the content? Get in touch with us directly. Alternatively, email editorial-team (at) simplywallst.com.
This article by Simply Wall St is general in nature. We provide commentary based on historical data and analyst forecasts only using an unbiased methodology and our articles are not intended to be financial advice. It does not constitute a recommendation to buy or sell any stock, and does not take account of your objectives, or your financial situation. We aim to bring you long-term focused analysis driven by fundamental data. Note that our analysis may not factor in the latest price-sensitive company announcements or qualitative material. Simply Wall St has no position in any stocks mentioned.