
Key Insights
- Hi Sun Technology (China)'s significant retail investors ownership suggests that the key decisions are influenced by shareholders from the larger public
- 46% of the business is held by the top 19 shareholders
- Insider ownership in Hi Sun Technology (China) is 37%
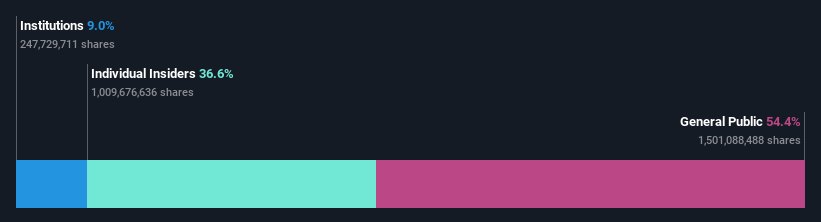
If you want to know who really controls Hi Sun Technology (China) Limited (HKG:818), then you'll have to look at the makeup of its share registry. The group holding the most number of shares in the company, around 54% to be precise, is retail investors. That is, the group stands to benefit the most if the stock rises (or lose the most if there is a downturn).
While insiders, who own 37% shares weren’t spared from last week’s HK$97m market cap drop, retail investors as a group suffered the maximum losses
In the chart below, we zoom in on the different ownership groups of Hi Sun Technology (China).
See our latest analysis for Hi Sun Technology (China)
What Does The Institutional Ownership Tell Us About Hi Sun Technology (China)?
Institutional investors commonly compare their own returns to the returns of a commonly followed index. So they generally do consider buying larger companies that are included in the relevant benchmark index.
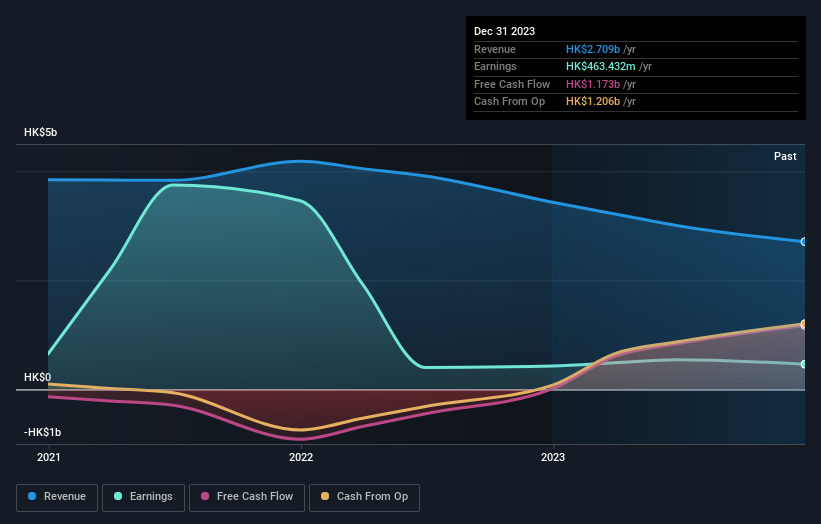
Hi Sun Technology (China) already has institutions on the share registry. Indeed, they own a respectable stake in the company. This can indicate that the company has a certain degree of credibility in the investment community. However, it is best to be wary of relying on the supposed validation that comes with institutional investors. They too, get it wrong sometimes. If multiple institutions change their view on a stock at the same time, you could see the share price drop fast. It's therefore worth looking at Hi Sun Technology (China)'s earnings history below. Of course, the future is what really matters.
We note that hedge funds don't have a meaningful investment in Hi Sun Technology (China). Looking at our data, we can see that the largest shareholder is the CEO Man Chun Kui with 23% of shares outstanding. With 12% and 7.1% of the shares outstanding respectively, Che Fung and Kopernik Global Investors, LLC are the second and third largest shareholders.
A deeper look at our ownership data shows that the top 19 shareholders collectively hold less than half of the register, suggesting a large group of small holders where no single shareholder has a majority.
While it makes sense to study institutional ownership data for a company, it also makes sense to study analyst sentiments to know which way the wind is blowing. Our information suggests that there isn't any analyst coverage of the stock, so it is probably little known.
Insider Ownership Of Hi Sun Technology (China)
The definition of an insider can differ slightly between different countries, but members of the board of directors always count. Management ultimately answers to the board. However, it is not uncommon for managers to be executive board members, especially if they are a founder or the CEO.
I generally consider insider ownership to be a good thing. However, on some occasions it makes it more difficult for other shareholders to hold the board accountable for decisions.
Our most recent data indicates that insiders own a reasonable proportion of Hi Sun Technology (China) Limited. Insiders have a HK$308m stake in this HK$841m business. We would say this shows alignment with shareholders, but it is worth noting that the company is still quite small; some insiders may have founded the business. You can click here to see if those insiders have been buying or selling.
General Public Ownership
The general public -- including retail investors -- own 54% of Hi Sun Technology (China). This level of ownership gives investors from the wider public some power to sway key policy decisions such as board composition, executive compensation, and the dividend payout ratio.
Next Steps:
While it is well worth considering the different groups that own a company, there are other factors that are even more important.
I like to dive deeper into how a company has performed in the past. You can access this interactive graph of past earnings, revenue and cash flow, for free.
Of course, you might find a fantastic investment by looking elsewhere. So take a peek at this free list of interesting companies.
NB: Figures in this article are calculated using data from the last twelve months, which refer to the 12-month period ending on the last date of the month the financial statement is dated. This may not be consistent with full year annual report figures.
Have feedback on this article? Concerned about the content? Get in touch with us directly. Alternatively, email editorial-team (at) simplywallst.com.
This article by Simply Wall St is general in nature. We provide commentary based on historical data and analyst forecasts only using an unbiased methodology and our articles are not intended to be financial advice. It does not constitute a recommendation to buy or sell any stock, and does not take account of your objectives, or your financial situation. We aim to bring you long-term focused analysis driven by fundamental data. Note that our analysis may not factor in the latest price-sensitive company announcements or qualitative material. Simply Wall St has no position in any stocks mentioned.