
As global markets exhibit volatility and investors react to mixed economic signals, the Hong Kong market has shown resilience, particularly within its small-cap segment. With broader market sentiment impacting small caps, identifying promising stocks requires a keen eye for companies with strong fundamentals and growth potential amidst these fluctuating conditions.
Top 10 Undiscovered Gems With Strong Fundamentals In Hong Kong
| Name | Debt To Equity | Revenue Growth | Earnings Growth | Health Rating |
|---|---|---|---|---|
| S.A.S. Dragon Holdings | 37.35% | 4.13% | 12.06% | ★★★★★★ |
| E-Commodities Holdings | 23.22% | 6.87% | 31.81% | ★★★★★★ |
| PW Medtech Group | NA | 17.93% | -2.70% | ★★★★★★ |
| Tianyun International Holdings | 10.09% | -5.59% | -9.92% | ★★★★★★ |
| JiaXing Gas Group | 17.72% | 26.04% | 22.07% | ★★★★★☆ |
| Hung Hing Printing Group | 3.97% | -2.51% | 33.57% | ★★★★★☆ |
| Changjiu Holdings | 14.09% | 12.87% | -4.74% | ★★★★★☆ |
| Mulsanne Group Holding | 186.88% | -12.02% | -43.54% | ★★★★☆☆ |
| Time Interconnect Technology | 212.50% | 27.21% | 15.01% | ★★★★☆☆ |
| Pizu Group Holdings | 48.34% | -4.53% | -19.78% | ★★★★☆☆ |
Underneath we present a selection of stocks filtered out by our screen.
Kinetic Development Group (SEHK:1277)
Simply Wall St Value Rating: ★★★★★☆
Overview: Kinetic Development Group Limited (SEHK:1277) is an investment holding company involved in the extraction and sale of coal products in the People’s Republic of China, with a market cap of HK$9.95 billion.
Operations: Kinetic Development Group Limited generates revenue primarily from the extraction and sale of coal products in China. The company's net profit margin is 18.5%.
Kinetic Development Group, a small cap in Hong Kong, has seen its debt to equity ratio reduce from 26.6% to 17.6% over the past five years. Despite negative earnings growth (-22%) compared to the industry average (-6.8%), it trades at 22.4% below estimated fair value and boasts high-quality earnings with EBIT covering interest payments by 55.7x. Recently, they announced a special dividend of HKD 0.04 per share payable on September 9, 2024.
- Dive into the specifics of Kinetic Development Group here with our thorough health report.
Gain insights into Kinetic Development Group's past trends and performance with our Past report.

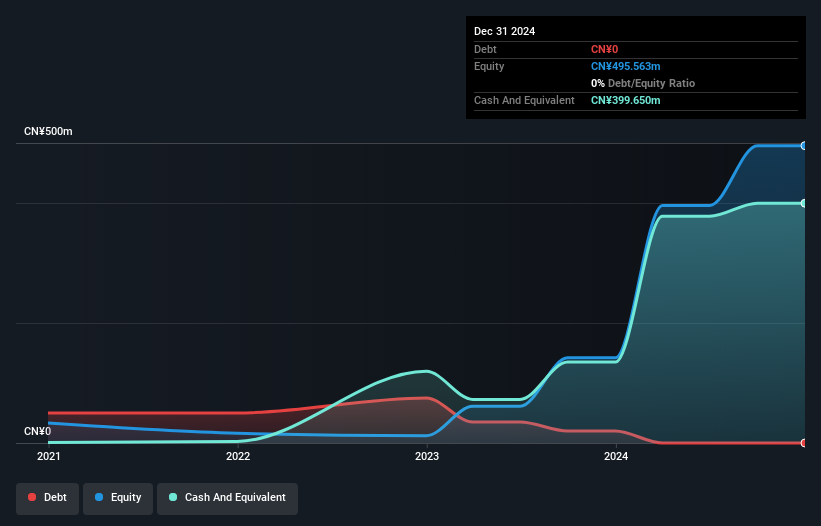
Changjiu Holdings (SEHK:6959)
Simply Wall St Value Rating: ★★★★★☆
Overview: Changjiu Holdings Limited operates in China, offering pledged vehicle monitoring and automobile dealership operation management services, with a market cap of HK$3.13 billion.
Operations: Changjiu Holdings Limited generates revenue primarily from pledged vehicle monitoring services (CN¥574.99 million) and automobile dealership operation management services (CN¥66.78 million).
Changjiu Holdings has shown promising growth, with net profit for the first half of 2024 expected to rise to RMB 55-60 million, up from RMB 35.3 million last year. The company launched its automobile supply chain service platform, 9CheGO, which now boasts over 12,000 dealership partners. Additionally, Changjiu entered a strategic cooperation with Gausscode Technology to enhance digitalisation and smart marketing efforts. The company's recent inclusion in the S&P Global BMI Index further highlights its growing market presence.
- Delve into the full analysis health report here for a deeper understanding of Changjiu Holdings.
Examine Changjiu Holdings' past performance report to understand how it has performed in the past.
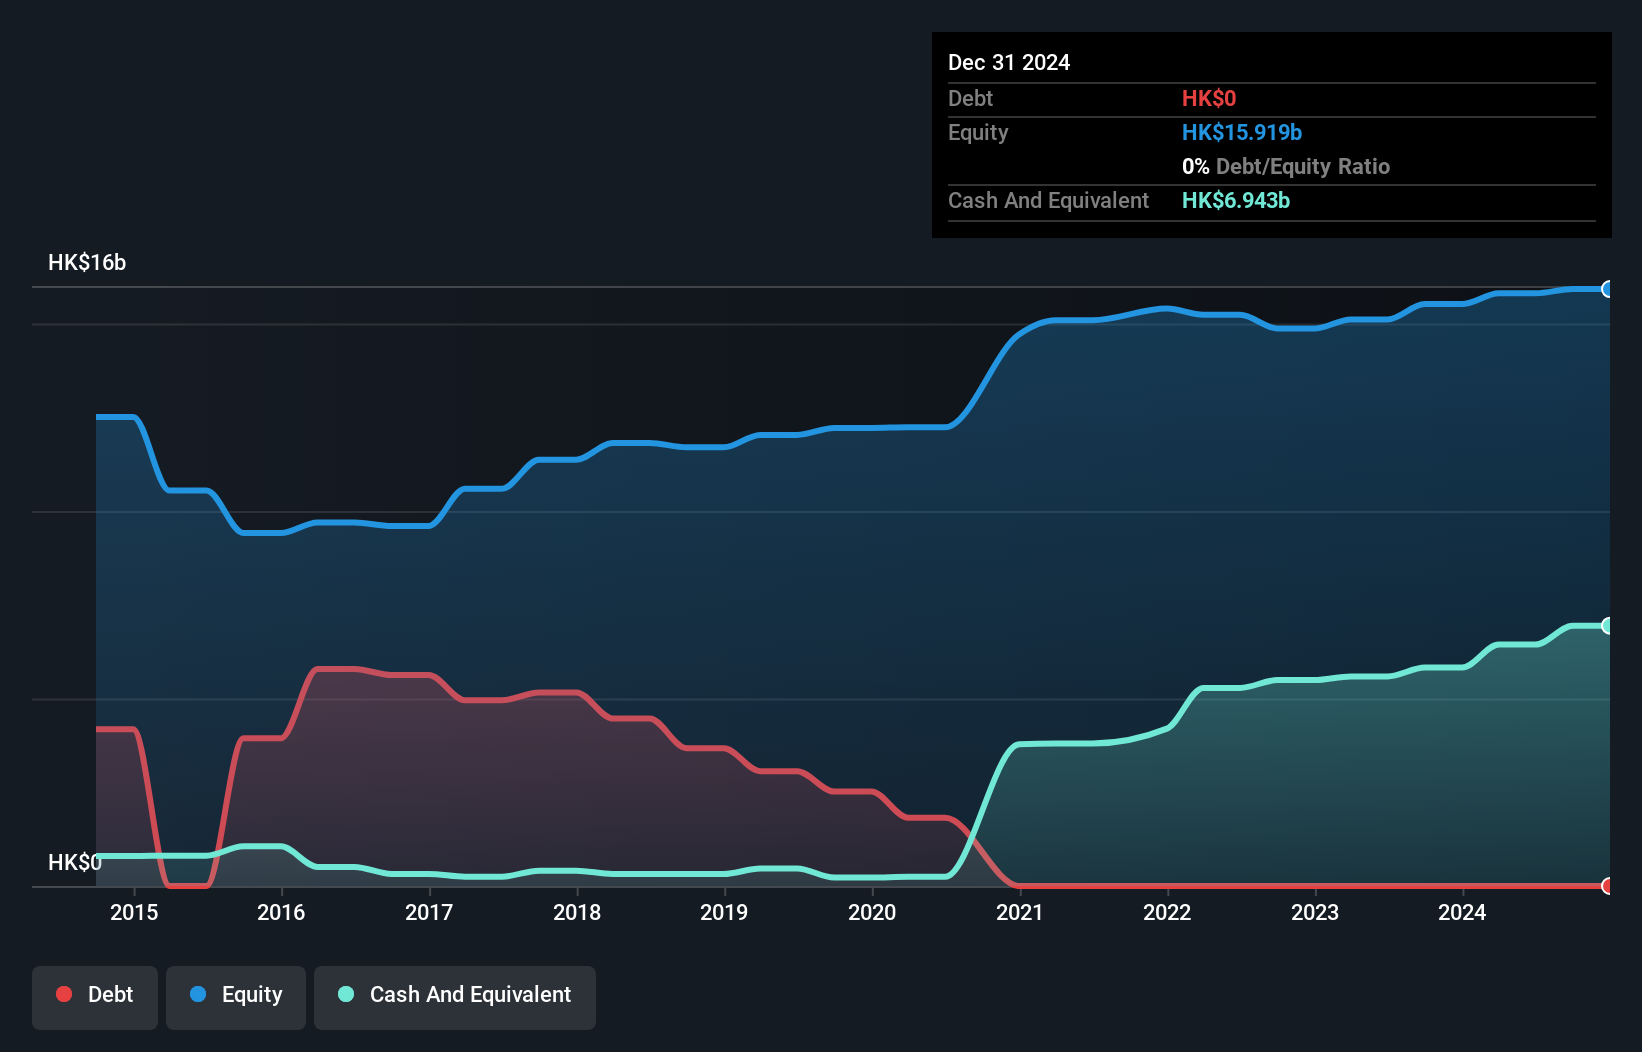
Sinopec Kantons Holdings (SEHK:934)
Simply Wall St Value Rating: ★★★★★★
Overview: Sinopec Kantons Holdings Limited, an investment holding company, provides crude oil jetty services and has a market cap of HK$11.49 billion.
Operations: The company generates revenue primarily from crude oil jetty and storage services, amounting to HK$609.87 million. Its financial performance includes a net profit margin of 5.67%.
Sinopec Kantons Holdings, a small cap player in Hong Kong's oil and gas sector, appears undervalued by 77% against fair value estimates. The company has no debt now compared to five years ago when its debt-to-equity ratio was 31.4%. Impressively, earnings grew by 198.6% over the past year, far outpacing the industry’s -6.8%. With a forecasted annual growth rate of 4%, Sinopec Kantons seems poised for steady progress under new leadership following recent board changes.
- Click to explore a detailed breakdown of our findings in Sinopec Kantons Holdings' health report.
Learn about Sinopec Kantons Holdings' historical performance.
Summing It All Up
- Embark on your investment journey to our 169 SEHK Undiscovered Gems With Strong Fundamentals selection here.
- Are you invested in these stocks already? Keep abreast of every twist and turn by setting up a portfolio with Simply Wall St, where we make it simple for investors like you to stay informed and proactive.
- Maximize your investment potential with Simply Wall St, the comprehensive app that offers global market insights for free.
Curious About Other Options?
- Explore high-performing small cap companies that haven't yet garnered significant analyst attention.
- Fuel your portfolio with companies showing strong growth potential, backed by optimistic outlooks both from analysts and management.
- Find companies with promising cash flow potential yet trading below their fair value.
This article by Simply Wall St is general in nature. We provide commentary based on historical data and analyst forecasts only using an unbiased methodology and our articles are not intended to be financial advice. It does not constitute a recommendation to buy or sell any stock, and does not take account of your objectives, or your financial situation. We aim to bring you long-term focused analysis driven by fundamental data. Note that our analysis may not factor in the latest price-sensitive company announcements or qualitative material. Simply Wall St has no position in any stocks mentioned.
Have feedback on this article? Concerned about the content? Get in touch with us directly. Alternatively, email editorial-team@simplywallst.com