
YTO International Express and Supply Chain Technology Limited (HKG:6123) shareholders that were waiting for something to happen have been dealt a blow with a 26% share price drop in the last month. The drop over the last 30 days has capped off a tough year for shareholders, with the share price down 29% in that time.
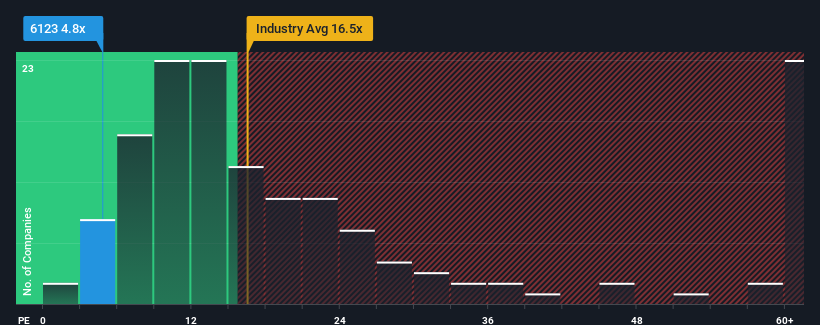
Although its price has dipped substantially, YTO International Express and Supply Chain Technology's price-to-earnings (or "P/E") ratio of 4.8x might still make it look like a buy right now compared to the market in Hong Kong, where around half of the companies have P/E ratios above 9x and even P/E's above 18x are quite common. Nonetheless, we'd need to dig a little deeper to determine if there is a rational basis for the reduced P/E.
As an illustration, earnings have deteriorated at YTO International Express and Supply Chain Technology over the last year, which is not ideal at all. One possibility is that the P/E is low because investors think the company won't do enough to avoid underperforming the broader market in the near future. However, if this doesn't eventuate then existing shareholders may be feeling optimistic about the future direction of the share price.
See our latest analysis for YTO International Express and Supply Chain Technology
What Are Growth Metrics Telling Us About The Low P/E?
There's an inherent assumption that a company should underperform the market for P/E ratios like YTO International Express and Supply Chain Technology's to be considered reasonable.
If we review the last year of earnings, dishearteningly the company's profits fell to the tune of 29%. As a result, earnings from three years ago have also fallen 62% overall. Accordingly, shareholders would have felt downbeat about the medium-term rates of earnings growth.
In contrast to the company, the rest of the market is expected to grow by 19% over the next year, which really puts the company's recent medium-term earnings decline into perspective.
With this information, we are not surprised that YTO International Express and Supply Chain Technology is trading at a P/E lower than the market. However, we think shrinking earnings are unlikely to lead to a stable P/E over the longer term, which could set up shareholders for future disappointment. Even just maintaining these prices could be difficult to achieve as recent earnings trends are already weighing down the shares.
The Final Word
YTO International Express and Supply Chain Technology's P/E has taken a tumble along with its share price. Using the price-to-earnings ratio alone to determine if you should sell your stock isn't sensible, however it can be a practical guide to the company's future prospects.
As we suspected, our examination of YTO International Express and Supply Chain Technology revealed its shrinking earnings over the medium-term are contributing to its low P/E, given the market is set to grow. Right now shareholders are accepting the low P/E as they concede future earnings probably won't provide any pleasant surprises. If recent medium-term earnings trends continue, it's hard to see the share price moving strongly in either direction in the near future under these circumstances.
Before you take the next step, you should know about the 2 warning signs for YTO International Express and Supply Chain Technology (1 is potentially serious!) that we have uncovered.
If these risks are making you reconsider your opinion on YTO International Express and Supply Chain Technology, explore our interactive list of high quality stocks to get an idea of what else is out there.
Have feedback on this article? Concerned about the content? Get in touch with us directly. Alternatively, email editorial-team (at) simplywallst.com.
This article by Simply Wall St is general in nature. We provide commentary based on historical data and analyst forecasts only using an unbiased methodology and our articles are not intended to be financial advice. It does not constitute a recommendation to buy or sell any stock, and does not take account of your objectives, or your financial situation. We aim to bring you long-term focused analysis driven by fundamental data. Note that our analysis may not factor in the latest price-sensitive company announcements or qualitative material. Simply Wall St has no position in any stocks mentioned.