
Long term investing is the way to go, but that doesn't mean you should hold every stock forever. It hits us in the gut when we see fellow investors suffer a loss. For example, we sympathize with anyone who was caught holding Sundart Holdings Limited (HKG:1568) during the five years that saw its share price drop a whopping 91%. And we doubt long term believers are the only worried holders, since the stock price has declined 25% over the last twelve months. The falls have accelerated recently, with the share price down 20% in the last three months. While a drop like that is definitely a body blow, money isn't as important as health and happiness.
Since Sundart Holdings has shed HK$86m from its value in the past 7 days, let's see if the longer term decline has been driven by the business' economics.
View our latest analysis for Sundart Holdings
There is no denying that markets are sometimes efficient, but prices do not always reflect underlying business performance. One way to examine how market sentiment has changed over time is to look at the interaction between a company's share price and its earnings per share (EPS).
During the five years over which the share price declined, Sundart Holdings' earnings per share (EPS) dropped by 2.8% each year. Readers should note that the share price has fallen faster than the EPS, at a rate of 39% per year, over the period. This implies that the market was previously too optimistic about the stock. The low P/E ratio of 2.19 further reflects this reticence.
You can see below how EPS has changed over time (discover the exact values by clicking on the image).
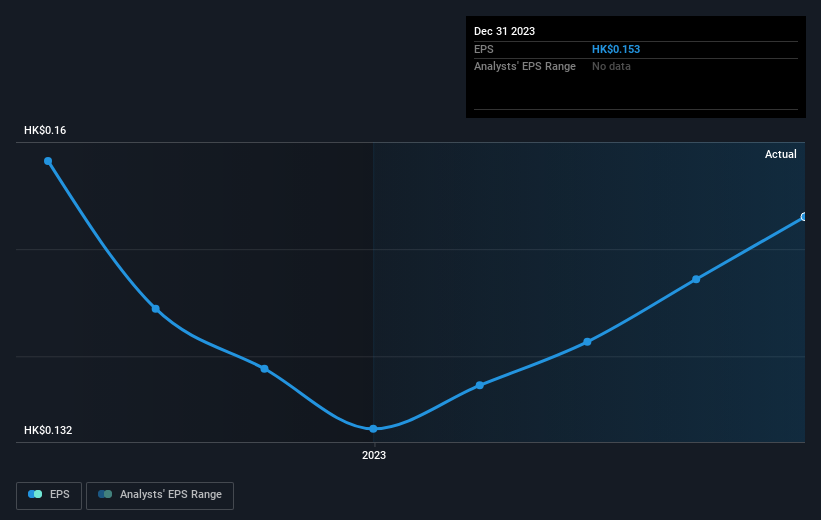
It might be well worthwhile taking a look at our free report on Sundart Holdings' earnings, revenue and cash flow.
What About The Total Shareholder Return (TSR)?
We'd be remiss not to mention the difference between Sundart Holdings' total shareholder return (TSR) and its share price return. The TSR attempts to capture the value of dividends (as if they were reinvested) as well as any spin-offs or discounted capital raisings offered to shareholders. Dividends have been really beneficial for Sundart Holdings shareholders, and that cash payout explains why its total shareholder loss of 88%, over the last 5 years, isn't as bad as the share price return.
A Different Perspective
We regret to report that Sundart Holdings shareholders are down 25% for the year. Unfortunately, that's worse than the broader market decline of 0.6%. Having said that, it's inevitable that some stocks will be oversold in a falling market. The key is to keep your eyes on the fundamental developments. Unfortunately, longer term shareholders are suffering worse, given the loss of 13% doled out over the last five years. We would want clear information suggesting the company will grow, before taking the view that the share price will stabilize. I find it very interesting to look at share price over the long term as a proxy for business performance. But to truly gain insight, we need to consider other information, too. To that end, you should learn about the 2 warning signs we've spotted with Sundart Holdings (including 1 which is significant) .
If you are like me, then you will not want to miss this free list of undervalued small caps that insiders are buying.
Please note, the market returns quoted in this article reflect the market weighted average returns of stocks that currently trade on Hong Kong exchanges.
Have feedback on this article? Concerned about the content? Get in touch with us directly. Alternatively, email editorial-team (at) simplywallst.com.
This article by Simply Wall St is general in nature. We provide commentary based on historical data and analyst forecasts only using an unbiased methodology and our articles are not intended to be financial advice. It does not constitute a recommendation to buy or sell any stock, and does not take account of your objectives, or your financial situation. We aim to bring you long-term focused analysis driven by fundamental data. Note that our analysis may not factor in the latest price-sensitive company announcements or qualitative material. Simply Wall St has no position in any stocks mentioned.