
As every investor would know, not every swing hits the sweet spot. But you have a problem if you face massive losses more than once in a while. So take a moment to sympathize with the long term shareholders of China Yongda Automobiles Services Holdings Limited (HKG:3669), who have seen the share price tank a massive 90% over a three year period. That might cause some serious doubts about the merits of the initial decision to buy the stock, to put it mildly. The more recent news is of little comfort, with the share price down 55% in a year. The falls have accelerated recently, with the share price down 20% in the last three months. While a drop like that is definitely a body blow, money isn't as important as health and happiness.
Since China Yongda Automobiles Services Holdings has shed HK$351m from its value in the past 7 days, let's see if the longer term decline has been driven by the business' economics.
See our latest analysis for China Yongda Automobiles Services Holdings
In his essay The Superinvestors of Graham-and-Doddsville Warren Buffett described how share prices do not always rationally reflect the value of a business. One imperfect but simple way to consider how the market perception of a company has shifted is to compare the change in the earnings per share (EPS) with the share price movement.
During the three years that the share price fell, China Yongda Automobiles Services Holdings' earnings per share (EPS) dropped by 27% each year. This reduction in EPS is slower than the 54% annual reduction in the share price. So it seems the market was too confident about the business, in the past. This increased caution is also evident in the rather low P/E ratio, which is sitting at 4.76.
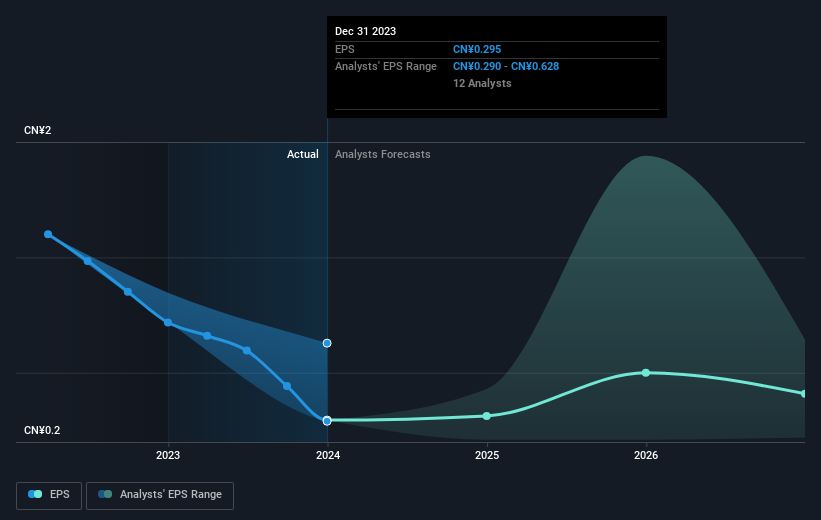
The graphic below depicts how EPS has changed over time (unveil the exact values by clicking on the image).
Before buying or selling a stock, we always recommend a close examination of historic growth trends, available here.
What About Dividends?
As well as measuring the share price return, investors should also consider the total shareholder return (TSR). Whereas the share price return only reflects the change in the share price, the TSR includes the value of dividends (assuming they were reinvested) and the benefit of any discounted capital raising or spin-off. Arguably, the TSR gives a more comprehensive picture of the return generated by a stock. In the case of China Yongda Automobiles Services Holdings, it has a TSR of -88% for the last 3 years. That exceeds its share price return that we previously mentioned. This is largely a result of its dividend payments!
A Different Perspective
While the broader market gained around 5.8% in the last year, China Yongda Automobiles Services Holdings shareholders lost 52% (even including dividends). However, keep in mind that even the best stocks will sometimes underperform the market over a twelve month period. Unfortunately, last year's performance may indicate unresolved challenges, given that it was worse than the annualised loss of 12% over the last half decade. We realise that Baron Rothschild has said investors should "buy when there is blood on the streets", but we caution that investors should first be sure they are buying a high quality business. It's always interesting to track share price performance over the longer term. But to understand China Yongda Automobiles Services Holdings better, we need to consider many other factors. Consider for instance, the ever-present spectre of investment risk. We've identified 2 warning signs with China Yongda Automobiles Services Holdings , and understanding them should be part of your investment process.
Of course China Yongda Automobiles Services Holdings may not be the best stock to buy. So you may wish to see this free collection of growth stocks.
Please note, the market returns quoted in this article reflect the market weighted average returns of stocks that currently trade on Hong Kong exchanges.
Have feedback on this article? Concerned about the content? Get in touch with us directly. Alternatively, email editorial-team (at) simplywallst.com.
This article by Simply Wall St is general in nature. We provide commentary based on historical data and analyst forecasts only using an unbiased methodology and our articles are not intended to be financial advice. It does not constitute a recommendation to buy or sell any stock, and does not take account of your objectives, or your financial situation. We aim to bring you long-term focused analysis driven by fundamental data. Note that our analysis may not factor in the latest price-sensitive company announcements or qualitative material. Simply Wall St has no position in any stocks mentioned.
Have feedback on this article? Concerned about the content? Get in touch with us directly. Alternatively, email editorial-team@simplywallst.com