
To the annoyance of some shareholders, FriendTimes Inc. (HKG:6820) shares are down a considerable 26% in the last month, which continues a horrid run for the company. Instead of being rewarded, shareholders who have already held through the last twelve months are now sitting on a 33% share price drop.
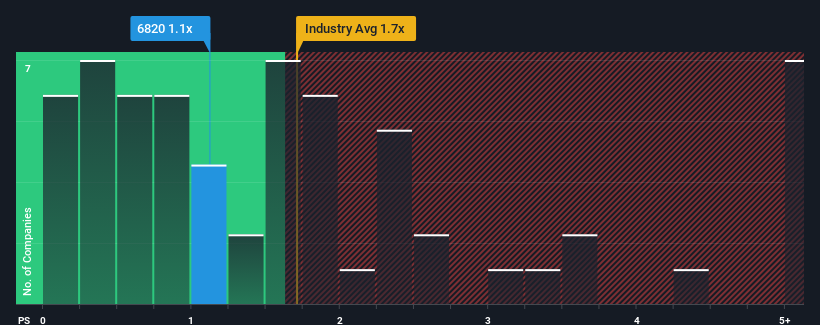
After such a large drop in price, it would be understandable if you think FriendTimes is a stock with good investment prospects with a price-to-sales ratios (or "P/S") of 1.1x, considering almost half the companies in Hong Kong's Entertainment industry have P/S ratios above 1.7x. However, the P/S might be low for a reason and it requires further investigation to determine if it's justified.
Check out our latest analysis for FriendTimes
What Does FriendTimes' P/S Mean For Shareholders?
While the industry has experienced revenue growth lately, FriendTimes' revenue has gone into reverse gear, which is not great. The P/S ratio is probably low because investors think this poor revenue performance isn't going to get any better. If this is the case, then existing shareholders will probably struggle to get excited about the future direction of the share price.
If you'd like to see what analysts are forecasting going forward, you should check out our free report on FriendTimes.Do Revenue Forecasts Match The Low P/S Ratio?
FriendTimes' P/S ratio would be typical for a company that's only expected to deliver limited growth, and importantly, perform worse than the industry.
Retrospectively, the last year delivered a frustrating 31% decrease to the company's top line. The last three years don't look nice either as the company has shrunk revenue by 52% in aggregate. Therefore, it's fair to say the revenue growth recently has been undesirable for the company.
Turning to the outlook, the next three years should generate growth of 25% each year as estimated by the two analysts watching the company. With the industry only predicted to deliver 18% per year, the company is positioned for a stronger revenue result.
With this in consideration, we find it intriguing that FriendTimes' P/S sits behind most of its industry peers. It looks like most investors are not convinced at all that the company can achieve future growth expectations.
The Bottom Line On FriendTimes' P/S
FriendTimes' recently weak share price has pulled its P/S back below other Entertainment companies. Generally, our preference is to limit the use of the price-to-sales ratio to establishing what the market thinks about the overall health of a company.
To us, it seems FriendTimes currently trades on a significantly depressed P/S given its forecasted revenue growth is higher than the rest of its industry. When we see strong growth forecasts like this, we can only assume potential risks are what might be placing significant pressure on the P/S ratio. While the possibility of the share price plunging seems unlikely due to the high growth forecasted for the company, the market does appear to have some hesitation.
Many other vital risk factors can be found on the company's balance sheet. You can assess many of the main risks through our free balance sheet analysis for FriendTimes with six simple checks.
If these risks are making you reconsider your opinion on FriendTimes, explore our interactive list of high quality stocks to get an idea of what else is out there.
Have feedback on this article? Concerned about the content? Get in touch with us directly. Alternatively, email editorial-team (at) simplywallst.com.
This article by Simply Wall St is general in nature. We provide commentary based on historical data and analyst forecasts only using an unbiased methodology and our articles are not intended to be financial advice. It does not constitute a recommendation to buy or sell any stock, and does not take account of your objectives, or your financial situation. We aim to bring you long-term focused analysis driven by fundamental data. Note that our analysis may not factor in the latest price-sensitive company announcements or qualitative material. Simply Wall St has no position in any stocks mentioned.
Have feedback on this article? Concerned about the content? Get in touch with us directly. Alternatively, email editorial-team@simplywallst.com