Those holding Fulum Group Holdings Limited (HKG:1443) shares would be relieved that the share price has rebounded 26% in the last thirty days, but it needs to keep going to repair the recent damage it has caused to investor portfolios. Unfortunately, the gains of the last month did little to right the losses of the last year with the stock still down 29% over that time.
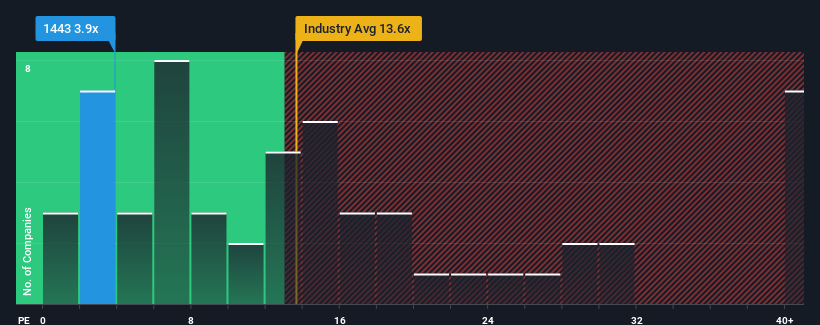
Although its price has surged higher, given about half the companies in Hong Kong have price-to-earnings ratios (or "P/E's") above 10x, you may still consider Fulum Group Holdings as a highly attractive investment with its 3.9x P/E ratio. Nonetheless, we'd need to dig a little deeper to determine if there is a rational basis for the highly reduced P/E.
With earnings growth that's exceedingly strong of late, Fulum Group Holdings has been doing very well. One possibility is that the P/E is low because investors think this strong earnings growth might actually underperform the broader market in the near future. If you like the company, you'd be hoping this isn't the case so that you could potentially pick up some stock while it's out of favour.
View our latest analysis for Fulum Group Holdings

What Are Growth Metrics Telling Us About The Low P/E?
Fulum Group Holdings' P/E ratio would be typical for a company that's expected to deliver very poor growth or even falling earnings, and importantly, perform much worse than the market.
Retrospectively, the last year delivered an exceptional 139% gain to the company's bottom line. Still, EPS has barely risen at all from three years ago in total, which is not ideal. Therefore, it's fair to say that earnings growth has been inconsistent recently for the company.
Weighing that recent medium-term earnings trajectory against the broader market's one-year forecast for expansion of 21% shows it's noticeably less attractive on an annualised basis.
In light of this, it's understandable that Fulum Group Holdings' P/E sits below the majority of other companies. It seems most investors are expecting to see the recent limited growth rates continue into the future and are only willing to pay a reduced amount for the stock.
The Final Word
Fulum Group Holdings' recent share price jump still sees its P/E sitting firmly flat on the ground. Using the price-to-earnings ratio alone to determine if you should sell your stock isn't sensible, however it can be a practical guide to the company's future prospects.
As we suspected, our examination of Fulum Group Holdings revealed its three-year earnings trends are contributing to its low P/E, given they look worse than current market expectations. Right now shareholders are accepting the low P/E as they concede future earnings probably won't provide any pleasant surprises. Unless the recent medium-term conditions improve, they will continue to form a barrier for the share price around these levels.
Before you take the next step, you should know about the 3 warning signs for Fulum Group Holdings that we have uncovered.
If P/E ratios interest you, you may wish to see this free collection of other companies with strong earnings growth and low P/E ratios.
Have feedback on this article? Concerned about the content? Get in touch with us directly. Alternatively, email editorial-team (at) simplywallst.com.
This article by Simply Wall St is general in nature. We provide commentary based on historical data and analyst forecasts only using an unbiased methodology and our articles are not intended to be financial advice. It does not constitute a recommendation to buy or sell any stock, and does not take account of your objectives, or your financial situation. We aim to bring you long-term focused analysis driven by fundamental data. Note that our analysis may not factor in the latest price-sensitive company announcements or qualitative material. Simply Wall St has no position in any stocks mentioned.
Have feedback on this article? Concerned about the content? Get in touch with us directly. Alternatively, email editorial-team@simplywallst.com