
Star Shine Holdings Group Limited (HKG:1440) shares have continued their recent momentum with a 31% gain in the last month alone. The last month tops off a massive increase of 116% in the last year.
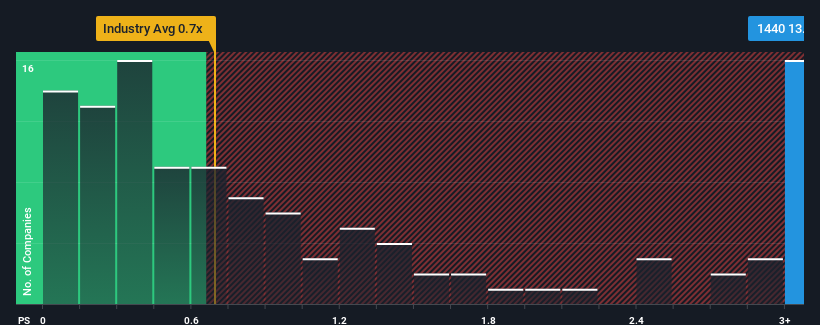
Following the firm bounce in price, you could be forgiven for thinking Star Shine Holdings Group is a stock to steer clear of with a price-to-sales ratios (or "P/S") of 13.8x, considering almost half the companies in Hong Kong's Luxury industry have P/S ratios below 0.7x. Nonetheless, we'd need to dig a little deeper to determine if there is a rational basis for the highly elevated P/S.
View our latest analysis for Star Shine Holdings Group
How Star Shine Holdings Group Has Been Performing
Star Shine Holdings Group certainly has been doing a great job lately as it's been growing its revenue at a really rapid pace. Perhaps the market is expecting future revenue performance to outperform the wider market, which has seemingly got people interested in the stock. However, if this isn't the case, investors might get caught out paying too much for the stock.
Although there are no analyst estimates available for Star Shine Holdings Group, take a look at this free data-rich visualisation to see how the company stacks up on earnings, revenue and cash flow.What Are Revenue Growth Metrics Telling Us About The High P/S?
The only time you'd be truly comfortable seeing a P/S as steep as Star Shine Holdings Group's is when the company's growth is on track to outshine the industry decidedly.
Taking a look back first, we see that the company grew revenue by an impressive 137% last year. The latest three year period has also seen an excellent 60% overall rise in revenue, aided by its short-term performance. Accordingly, shareholders would have definitely welcomed those medium-term rates of revenue growth.
Comparing that recent medium-term revenue trajectory with the industry's one-year growth forecast of 13% shows it's noticeably more attractive.
With this in consideration, it's not hard to understand why Star Shine Holdings Group's P/S is high relative to its industry peers. It seems most investors are expecting this strong growth to continue and are willing to pay more for the stock.
What We Can Learn From Star Shine Holdings Group's P/S?
Shares in Star Shine Holdings Group have seen a strong upwards swing lately, which has really helped boost its P/S figure. While the price-to-sales ratio shouldn't be the defining factor in whether you buy a stock or not, it's quite a capable barometer of revenue expectations.
We've established that Star Shine Holdings Group maintains its high P/S on the strength of its recent three-year growth being higher than the wider industry forecast, as expected. Right now shareholders are comfortable with the P/S as they are quite confident revenue aren't under threat. Unless the recent medium-term conditions change, they will continue to provide strong support to the share price.
You need to take note of risks, for example - Star Shine Holdings Group has 2 warning signs (and 1 which is a bit unpleasant) we think you should know about.
Of course, profitable companies with a history of great earnings growth are generally safer bets. So you may wish to see this free collection of other companies that have reasonable P/E ratios and have grown earnings strongly.
Have feedback on this article? Concerned about the content? Get in touch with us directly. Alternatively, email editorial-team (at) simplywallst.com.
This article by Simply Wall St is general in nature. We provide commentary based on historical data and analyst forecasts only using an unbiased methodology and our articles are not intended to be financial advice. It does not constitute a recommendation to buy or sell any stock, and does not take account of your objectives, or your financial situation. We aim to bring you long-term focused analysis driven by fundamental data. Note that our analysis may not factor in the latest price-sensitive company announcements or qualitative material. Simply Wall St has no position in any stocks mentioned.