
Tian Yuan Group Holdings (HKG:6119) has had a great run on the share market with its stock up by a significant 116% over the last three months. We wonder if and what role the company's financials play in that price change as a company's long-term fundamentals usually dictate market outcomes. Particularly, we will be paying attention to Tian Yuan Group Holdings' ROE today.
Return on equity or ROE is an important factor to be considered by a shareholder because it tells them how effectively their capital is being reinvested. In short, ROE shows the profit each dollar generates with respect to its shareholder investments.
See our latest analysis for Tian Yuan Group Holdings
How Is ROE Calculated?
The formula for ROE is:
Return on Equity = Net Profit (from continuing operations) ÷ Shareholders' Equity
So, based on the above formula, the ROE for Tian Yuan Group Holdings is:
7.5% = CN¥26m ÷ CN¥346m (Based on the trailing twelve months to December 2023).
The 'return' is the income the business earned over the last year. That means that for every HK$1 worth of shareholders' equity, the company generated HK$0.07 in profit.
Why Is ROE Important For Earnings Growth?
So far, we've learned that ROE is a measure of a company's profitability. Depending on how much of these profits the company reinvests or "retains", and how effectively it does so, we are then able to assess a company’s earnings growth potential. Generally speaking, other things being equal, firms with a high return on equity and profit retention, have a higher growth rate than firms that don’t share these attributes.
Tian Yuan Group Holdings' Earnings Growth And 7.5% ROE
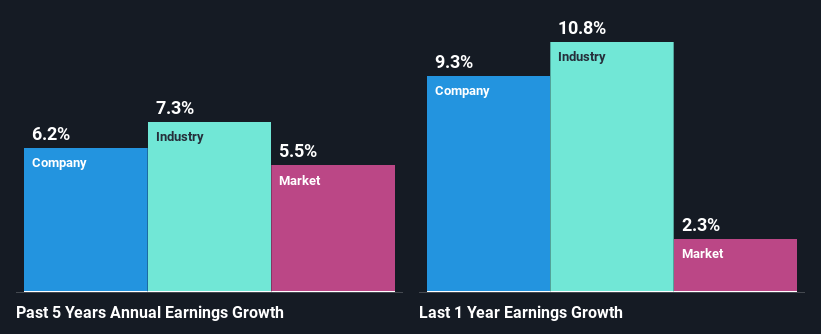
On the face of it, Tian Yuan Group Holdings' ROE is not much to talk about. However, its ROE is similar to the industry average of 7.7%, so we won't completely dismiss the company. Even so, Tian Yuan Group Holdings has shown a fairly decent growth in its net income which grew at a rate of 6.2%. Taking into consideration that the ROE is not particularly high, we reckon that there could also be other factors at play which could be influencing the company's growth. For example, it is possible that the company's management has made some good strategic decisions, or that the company has a low payout ratio.
We then performed a comparison between Tian Yuan Group Holdings' net income growth with the industry, which revealed that the company's growth is similar to the average industry growth of 7.3% in the same 5-year period.
Earnings growth is a huge factor in stock valuation. It’s important for an investor to know whether the market has priced in the company's expected earnings growth (or decline). Doing so will help them establish if the stock's future looks promising or ominous. One good indicator of expected earnings growth is the P/E ratio which determines the price the market is willing to pay for a stock based on its earnings prospects. So, you may want to check if Tian Yuan Group Holdings is trading on a high P/E or a low P/E, relative to its industry.
Is Tian Yuan Group Holdings Efficiently Re-investing Its Profits?
While the company did pay out a portion of its dividend in the past, it currently doesn't pay a regular dividend. We infer that the company has been reinvesting all of its profits to grow its business.
Summary
On the whole, we do feel that Tian Yuan Group Holdings has some positive attributes. Despite its low rate of return, the fact that the company reinvests a very high portion of its profits into its business, no doubt contributed to its high earnings growth. So far, we've only made a quick discussion around the company's earnings growth. To gain further insights into Tian Yuan Group Holdings' past profit growth, check out this visualization of past earnings, revenue and cash flows.
Have feedback on this article? Concerned about the content? Get in touch with us directly. Alternatively, email editorial-team (at) simplywallst.com.
This article by Simply Wall St is general in nature. We provide commentary based on historical data and analyst forecasts only using an unbiased methodology and our articles are not intended to be financial advice. It does not constitute a recommendation to buy or sell any stock, and does not take account of your objectives, or your financial situation. We aim to bring you long-term focused analysis driven by fundamental data. Note that our analysis may not factor in the latest price-sensitive company announcements or qualitative material. Simply Wall St has no position in any stocks mentioned.