How to read bids and asks?
Quite a few people make trade decisions based entirely on the current market prices they see, neglecting bid and ask information. However, it’s important to note that the current market price is the price of the last trade. Bid and ask, on the other hand, are prices at which investors are willing to trade.
To be specific, the bid is the price a buyer is willing to pay for a stock. The ask is the price a seller will accept for the stock.
Level 1 bid and ask
In level 1, only the best bid and ask are shown. In the example below, the highest price that the market is willing to pay for stock A is $164.80 (the bid price), and the aggregate number of shares to be traded at this price is 5,001 (the bid size). If an investor places a market order to sell Stock A, the order will most likely be filled at the price of $164.8. This is because there are plenty of orders to be filled at $164.80.
On the right side of the example below, the lowest price the market is willing to accept for the sale of stock A is $164.87 (the ask price), and the aggregate number of shares to be traded at this price is 2 (the ask size). If an investor places a market order to purchase shares of stock A, the order will most likely be filled at a price above $164.87. This is because there are only 2 shares to be sold at $164.87. If an investor enters a buy limit order with a limit price set above $164.80, the order may become the new best bid.
The difference between the bid and ask is called the spread. The depth of bids and asks (number of bids and asks in the market) could impact the spread significantly. If there are fewer bids or fewer asks in the market, the spread could be wide. In this case, placing a market order can be risky. In the example below, the spread is only $0.07.

Level 2 bid and ask
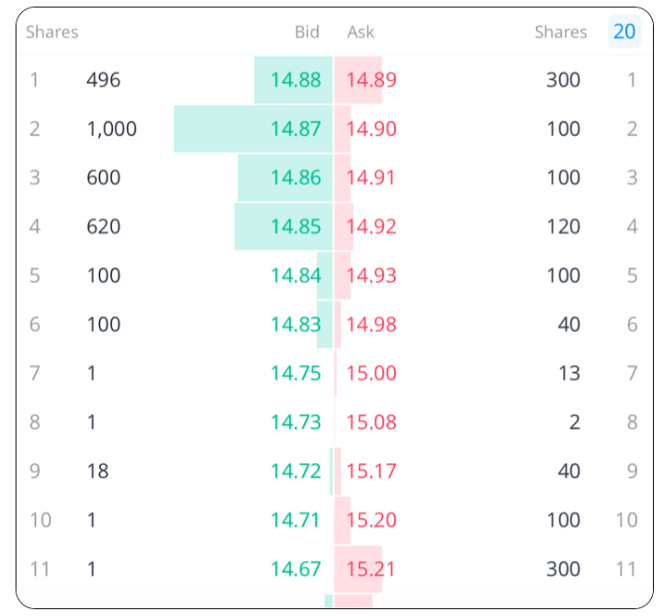
In level 2, up to 50 best bids and asks can be displayed.
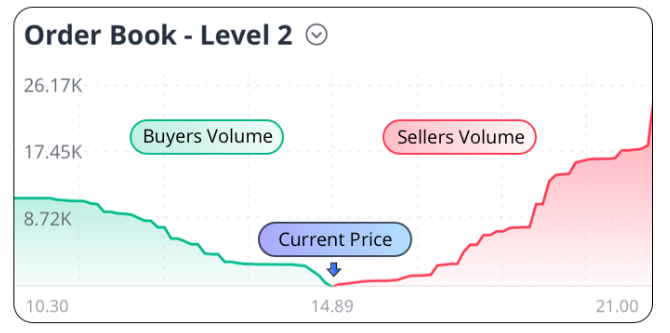
Above the 50 bids and asks, a summary is presented in a chart. In this chart, the horizontal axis describes the price, and the vertical axis describes the volume. The green shaded area on the left is the buyer’s volume, while the red shaded area on the right is the seller’s volume. At the bottom of the chart where the green and red lines are joined, the current market price is displayed.
In the example below, we can see that the seller’s volume is higher than the buyer’s volume. This means the market is currently bearish towards Stock B.

Below the chart, there are up to 50 bids and asks, with the best displayed first. You can customise the number of bid and ask prices that are displayed by tapping the number in the upper right corner, above bid and ask prices.

Reference:
https://corporatefinanceinstitute.com/resources/knowledge/trading-investing/bid-and-ask/
https://successfultradings.com/how-to-use-level-2-market-data-on-webull/
https://www.investopedia.com/ask/answers/06/bidasknumbers.asp
